 [div class=attrib]From Slate:[end-div]
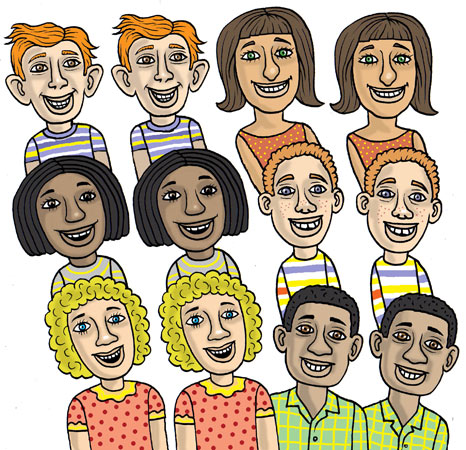
Twenty-five years ago, almost no one had a cell phone. Very few of us had digital cameras, and laptop computers belonged only to the very rich. But there is something else—not electronic, but also man-made—that has climbed from the margins of the culture in the 1980s to become a standard accoutrement in upscale neighborhoods across the land: twins.
According to the latest data from the Centers for Disease Control and Prevention the U.S. twin rate has skyrocketed from one pair born out of every 53 live births in 1980 to one out of every 31 births in 2008. Where are all these double-babies coming from? And what’s going to happen in years to come—will the multiple-birth rate continue to grow until America ends up a nation of twins?
The twin boom can be explained by changes in when and how women are getting pregnant. Demographers have in recent years described a “delayer boom,” in which birth rates have risen among the sort of women—college-educated—who tend to put off starting a family into their mid-30s or beyond. There are now more in this group than ever before: In 1980, just 12.8 percent of women had attained a bachelor’s degree or higher; by 2010, that number had almost tripled, to 37 percent. And women in their mid-30s have multiple births at a higher rate than younger women. A mother who is 35, for example, is four times more likely than a mother who is 20 to give birth to twins. That seems to be on account of her producing more follicle-stimulating hormone, or FSH, which boosts ovulation. The more FSH you have in your bloodstream, the greater your chances of producing more than one egg in each cycle, and having fraternal twins as a result.
[div class=attrib]More from theSource here.[end-div]


 [div class=attrib]From Slate:[end-div]