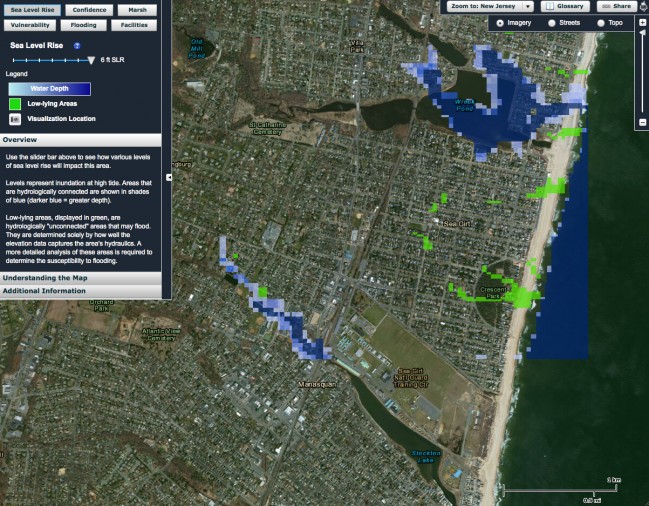
We love maps here at theDiagonal. So much so that we’ve begun a new feature: MondayMap. As the name suggests, we plan to feature fascinating new maps on Mondays. For our readers who prefer their plots served up on a Saturday, sorry. Usually we like to highlight maps that cause us to look at our world differently or provide a degree of welcome amusement, such as the wonderful trove of maps over at Strange Maps curated by Frank Jacobs.
However, this first MondayMap is a little different and serious. It’s an interactive map that shows the impact of estimated sea level rise on the streets of New Jersey. Obviously, such a tool would be a great boon for emergency services and urban planners. For the rest of us, whether we live in New Jersey or not, maps like this one — of extreme weather events and projections — are likely to become much more common over the coming decades. Kudos to researchers at Rutgers University for developing the NJ Flood Mapper.
[div class=attrib]From Wall Street Journal:[end-div]
While superstorm Sandy revealed the Northeast’s vulnerability, a new map by New Jersey scientists suggests how rising seas could make future storms even worse.
The map shows ocean waters surging more than a mile into communities along Raritan Bay, engulfing nearly all of New Jersey’s barrier islands and covering northern sections of the New Jersey Turnpike and land surrounding the Port Newark Container Terminal.
Such damage could occur under a scenario in which sea levels rise 6 feet—or a 3-foot rise in tandem with a powerful coastal storm, according to the map produced by Rutgers University researchers.
The satellite-based tool, one of the first comprehensive, state-specific maps of its kind, uses a Google-maps-style interface that allows viewers to zoom into street-level detail.
“We are not trying to unduly frighten people,” said Rick Lathrop, director of the Grant F. Walton Center for Remote Sensing and Spatial Analysis at Rutgers, who led the map’s development. “This is providing people a look at where our vulnerability is.”
Still, the implications of the Rutgers project unnerve residents of Surf City, on Long Beach Island, where the map shows water pouring over nearly all of the barrier island’s six municipalities with a 6-foot increase in sea levels.
“The water is going to come over the island and there will be no island,” said Barbara Epstein, a 73-year-old resident of nearby Barnegat Light, who added that she is considering moving after 12 years there. “The storms are worsening.”
To be sure, not everyone agrees that climate change will make sea-level rise more pronounced.
Politically, climate change remains an issue of debate. New York Gov. Andrew Cuomo has said Sandy showed the need to address the issue, while New Jersey Gov. Chris Christie has declined to comment on whether Sandy was linked to climate change.
Scientists have gone ahead and started to map sea-level-rise scenarios in New Jersey, New York City and flood-prone communities along the Gulf of Mexico to help guide local development and planning.
Sea levels have risen by 1.3 feet near Atlantic City and 0.9 feet by Battery Park between 1911 and 2006, according to data from the National Oceanic and Atmospheric Administration.
A serious storm could add at least another 3 feet, with historic storm surges—Sandy-scale—registering at 9 feet. So when planning for future coastal flooding, 6 feet or higher isn’t far-fetched when combining sea-level rise with high tides and storm surges, Mr. Lathrop said.
NOAA estimated in December that increasing ocean temperatures could cause sea levels to rise by 1.6 feet in 100 years, and by 3.9 feet if considering some level of Arctic ice-sheet melt.
Such an increase amounts to 0.16 inches per year, but the eventual impact could mean that a small storm could “do the same damage that Sandy did,” said Peter Howd, co-author of a 2012 U.S. Geological Survey report that found the rate of sea level rise had increased in the northeast.
[div class=attrib]Read the entire article after the jump.[end-div]
[div class=attrib]Image: NJ Flood Mapper. Courtesy of Grant F. Walton Center for Remote Sensing and Spatial Analysis (CRSSA), Rutgers University, in partnership with the Jacques Cousteau National Estuarine Research Reserve (JCNERR), and in collaboration with the NOAA Coastal Services Center (CSC).[end-div]

