Tag Archives: sea-level

April Fool!

NASA-Thwaites Glacier

The media loves to prank us with a good April Fools’ joke each year. This one is a gem — human-driven climate change will melt our glaciers and polar ice at an increasingly faster pace than previously calculated. Result: faster rising oceans leading to higher ocean levels. What a great joke!

And, to quote the Republican front-runner for the presidential nomination, “I think our biggest form of climate change we should worry about is nuclear weapons.” Or, was it “a hoax created by the Chinese“?

Care to follow more of this global joke? Check out this peer reviewed paper.

Image: Icebergs that have broken from the calving side of Thwaites Glacier in Antarctica, November 2014. Courtesy Jim Yungel/NASA.

Thwaites

thwaits_icebridge_2012

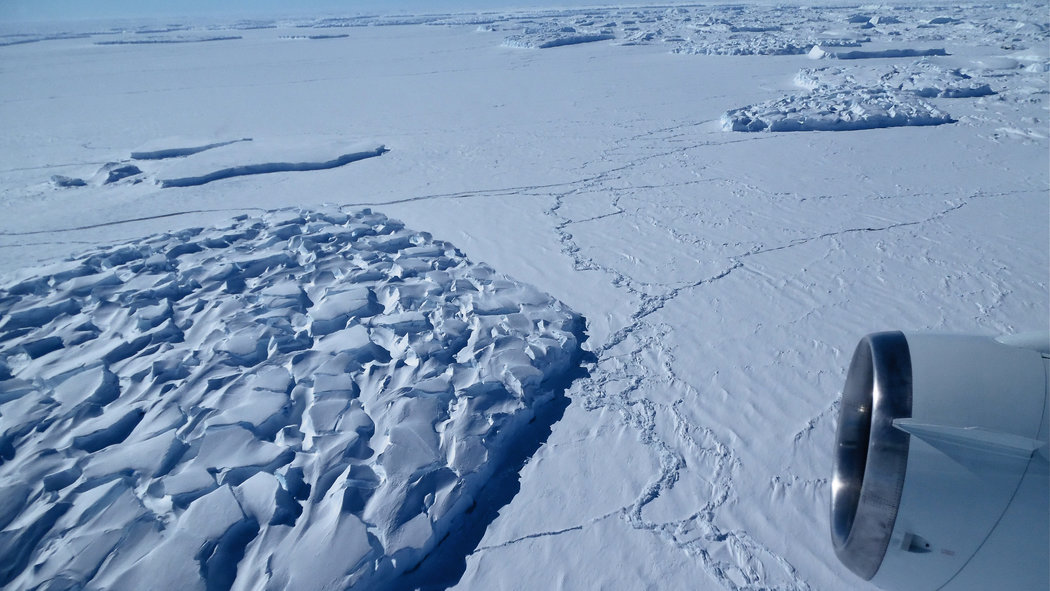
Over the coming years the words “Thwaites Glacier” will become known to many people, especially those who make their home near the world’s oceans. The thawing of Antarctic ice and the accelerating melting of its glaciers — of which Thwaites is a prime example — pose an increasing threat to our coasts, but imperil us all.

Thwaites is one of size mega-glaciers that drain into the West Antarctic’s Amundsen Sea. If all were to melt completely, as they are continuing to do, global sea-level would be projected to rise an average of 4½ feet. Astonishingly, this catastrophe in the making has passed a tipping-point — climatologists and glaciologists now tend to agree that the melting is irreversible and accelerating.

From ars technica:

Today, researchers at UC Irvine and the Jet Propulsion Laboratory have announced results indicating that glaciers across a large area of West Antarctica have been destabilized and that there is little that will stop their continuing retreat. These glaciers are all that stand between the ocean and a massive basin of ice that sits below sea level. Should the sea invade this basin, we’d be committed to several meters of sea level rise.

Even in the short term, the new findings should increase our estimates for sea level rise by the end of the century, the scientists suggest. But the ongoing process of retreat and destabilization will mean that the area will contribute to rising oceans for centuries.

The press conference announcing these results is ongoing. We will have a significant update on this story later today.

UPDATE (2:05pm CDT):

The glaciers in question are in West Antarctica, and drain into the Amundsen Sea. On the coastal side, the ends of the glacier are actually floating on ocean water. Closer to the coast, there’s what’s called a “grounding line,” where the weight of the ice above sea level pushes the bottom of the glacier down against the sea bed. From there on, back to the interior of Antarctica, all of the ice is directly in contact with the Earth.

That’s a rather significant fact, given that, just behind a range of coastal hills, all of the ice is sitting in a huge basin that’s significantly below sea level. In total, the basin contains enough ice to raise sea levels approximately four meters, largely because the ice piled in there rises significantly above sea level.

Because of this configuration, the grounding line of the glaciers that drain this basin act as a protective barrier, keeping the sea back from the base of the deeper basin. Once ocean waters start infiltrating the base of a glacier, the glacier melts, flows faster, and thins. This lessens the weight holding the glacier down, ultimately causing it to float, which hastens its break up. Since the entire basin is below sea level (in some areas by over a kilometer), water entering the basin via any of the glaciers could destabilize the entire thing.

Thus, understanding the dynamics of the grounding lines is critical. Today’s announcements have been driven by two publications. One of them models the behavior of one of these glaciers, and shows that it has likely reached a point where it will be prone to a sudden retreat sometime in the next few centuries. The second examines every glacier draining this basin, and shows that all but one of them are currently losing contact with their grounding lines.

Ungrounded

The data come from two decades worth of data from the ESA’s Earth Remote Sensing satellites. These include radar that performs two key functions: peers through the ice to get a sense of the terrain that lies buried under the ice near the grounding line. And, through interferometry, it tracks the dynamics of the ice sheet’s flow in the area, as well as its thinning and the location of the grounding line itself. The study tracks a number of glaciers that all drain into the region: Pine Island, Thwaites, Haynes, and Smith/Kohler.

As we’ve covered previously, the Pine Island Glacier came ungrounded in the second half of the past decade, retreating up to 31km in the process. Although this was the one that made headlines, all the glaciers in the area are in retreat. Thwaites saw areas retreat up to 14km over the course of the study, Haynes retracted by 10km, and the Smith/Kohler glaciers retreated by 35km.

The retreating was accompanied by thinning of the glaciers, as ice that had been held back above sea levels in the interior spread forward and thinned out. This contributed to sea level rise, and the speakers at the press conference agreed that the new data shows that the recently released IPCC estimates for sea level rise are out of date; even by the end of this century, the continuation of this process will significantly increase the rate of sea level rise we can expect.

The real problem, however, comes later. Glaciers can establish new grounding lines if there’s a feature in the terrain, such as a hill that rises above sea level, that provides a new anchoring point. The authors see none: “Upstream of the 2011 grounding line positions, we find no major bed obstacle that would prevent the glaciers from further retreat and draw down the entire basin.” In fact, several of the existing grounding lines are close to points where the terrain begins to slope downward into the basin.

For some of the glaciers, the problems are already starting. At Pine Island, the bottom of the glacier is now sitting on terrain that’s 400 meters deeper than where the end rested in 1992, and there are no major hills between there and the basin. As far as the Smith/Kohler glaciers, the grounding line is 800 meters deeper and “its ice shelf pinning points are vanishing.”

What’s next?

As a result, the authors concluded that these glaciers are essentially destabilized—unless something changes radically, they’re destined for retreat into the indefinite future. But what will the trajectory of that retreat look like? In this case, the data doesn’t directly help. It needs to be fed into a model that projects the current melting into the future. Conveniently, a different set of scientists has already done this modeling.

The work focuses on the Thwaites glacier, which appears to be the most stable: there are 60-80km before between the existing terminus and the deep basin, and two or three ridges within that distance that will allow the formation of new grounding lines.

The authors simulated the behavior of Thwaites using a number of different melting rates. These ranged from a low that approximated the behavior typical in the early 90s, to a high rate of melt that is similar to what was observed in recent years. Every single one of these situations saw the Thwaites retreat into the deep basin within the next 1,000 years. In the higher melt scenarios—the ones most reflective of current conditions—this typically took only a few centuries.

The other worrisome behavior is that there appeared to be a tipping point. In every simulation that saw an extensive retreat, rates of melting shifted from under 80 gigatonnes of ice per year to 150 gigatonnes or more, all within the span of a couple of decades. In the later conditions, this glacier alone contributed half a centimeter to sea level rise—every year.

Read the entire article here.

Image: Thwaites Glacier, Antarctica, 2012. Courtesy of NASA Earth Observatory.

Sea Levels Just Keep Rising, Really

house-on-holland-island

The rise in the global sea level is not a disputable fact, as some would still have you believe. The sea level is rising and it is rising faster. It is a fact backed by evidence. Period. This fact has been established through continuous, independent and corroborated scientific studies in many nations across all continents by thousands of scientists.

And, as the oceans rise communities that touch the water face increasing threats. A growing number of areas now have to plan and prepare for more frequent and more prolonged tidal erosion and storm surges. Worse still, some communities, in increasing numbers, have to confront the prospect of complete resettlement caused by the real danger of prolonged and irreversible flooding. Today it may be some of the low lying areas of Norfolk, Virginia or a remote Pacific Island; tomorrow it may be all of downtown Miami and much of the Eastern Seaboard of the US.

From the New York Times:

The little white shack at the water’s edge in Lower Manhattan is unobtrusive — so much so that the tourists strolling the promenade at Battery Park the other day did not give it a second glance.

Up close, though, the roof of the shed behind a Coast Guard building bristled with antennas and other gear. Though not much bigger than a closet, this facility is helping scientists confront one of the great environmental mysteries of the age.

The equipment inside is linked to probes in the water that keep track of the ebb and flow of the tides in New York Harbor, its readings beamed up to a satellite every six minutes.

While the gear today is of the latest type, some kind of tide gauge has been operating at the Battery since the 1850s, by a government office originally founded by Thomas Jefferson. That long data record has become invaluable to scientists grappling with this question: How much has the ocean already risen, and how much more will it go up?

Scientists have spent decades examining all the factors that can influence the rise of the seas, and their research is finally leading to answers. And the more the scientists learn, the more they perceive an enormous risk for the United States.

Much of the population and economy of the country is concentrated on the East Coast., which the accumulating scientific evidence suggests will be a global hot spot for a rising sea level over the coming century.

The detective work has required scientists to grapple with the influence of ancient ice sheets, the meaning of islands that are sinking in Chesapeake Bay, and even the effect of a giant meteor that slammed into the earth.

The work starts with the tides. Because of their importance to navigation, they have been measured for the better part of two centuries. While the record is not perfect, scientists say it leaves no doubt that the world’s oceans are rising. The best calculation suggests that from 1880 to 2009, the global average sea level rose a little over eight inches.

That may not sound like much, but scientists say even the smallest increase causes the seawater to eat away more aggressively at the shoreline in calm weather, and leads to higher tidal surges during storms. The sea-level rise of decades past thus explains why coastal towns nearly everywhere are having to spend billions of dollars fighting erosion.

The evidence suggests that the sea-level rise has probably accelerated, to about a foot a century, and scientists think it will accelerate still more with the continued emission of large amounts of greenhouse gases into the air. The gases heat the planet and cause land ice to melt into the sea.

The official stance of the world’s climate scientists is that the global sea level could rise as much as three feet by the end of this century, if emissions continue at a rapid pace. But some scientific evidence supports even higher numbers, five feet and beyond in the worst case.

Scientists say the East Coast will be hit harder for many reasons, but among the most important is that even as the seawater rises, the land in this part of the world is sinking. And that goes back to the last ice age, which peaked some 20,000 years ago.

As a massive ice sheet, more than a mile thick, grew over what are now Canada and the northern reaches of the United States, the weight of it depressed the crust of the earth. Areas away from the ice sheet bulged upward in response, as though somebody had stepped on one edge of a balloon, causing the other side to pop up. Now that the ice sheet has melted, the ground that was directly beneath it is rising, and the peripheral bulge is falling.

Some degree of sinking is going on all the way from southern Maine to northern Florida, and it manifests itself as an apparent rising of the sea.

The sinking is fastest in the Chesapeake Bay region. Whole island communities that contained hundreds of residents in the 19th century have already disappeared. Holland Island, where the population peaked at nearly 400 people around 1910, had stores, a school, a baseball team and scores of homes. But as the water rose and the island eroded, the community had to be abandoned.

Eventually just a single, sturdy Victorian house, built in 1888, stood on a remaining spit of land, seeming at high tide to rise from the waters of the bay itself. A few years ago, a Washington Post reporter, David A. Fahrenthold, chronicled its collapse.

Aside from this general sinking of land up and down the East Coast, some places sit on soft sediments that tend to compress over time, so the localized land subsidence can be even worse than the regional trend. Much of the New Jersey coast is like that. The sea-level record from the Battery has been particularly valuable in sorting out this factor, because the tide gauge there is attached to bedrock and the record is thus immune to sediment compression.

Read the entire article here.

Image: The last house on Holland Island in Chesapeake Bay, which once had a population of almost 400, finally toppled in October 2010. Courtesy of Astrid Riecken for The Washington Post.

Only Three Feet

Three feet. Three feet is nothing you say. Three feet is less than the difference between the shallow and deep ends of most swimming pools. Well, when the three feet is the mean ocean level rise it becomes a little more significant. And, when that three feet is the rise predicted to happen within the next 87 years, by 2100, it’s, well, how do you say, catastrophic.

A rise like that and you can kiss goodbye to your retirement home in Miami, and for that matter, kiss goodbye to much of southern Florida, and many coastal communities around the world.

From the New York Times:

An international team of scientists has found with near certainty that human activity is the cause of most of the temperature increases of recent decades, and warns that sea levels could rise by more than three feet by the end of the century if emissions continue at a runaway pace.

The scientists, whose findings are reported in a summary of the next big United Nations climate report, largely dismiss a recent slowdown in the pace of warming, which is often cited by climate change contrarians, as probably related to short-term factors. The report emphasizes that the basic facts giving rise to global alarm about future climate change are more established than ever, and it reiterates that the consequences of runaway emissions are likely to be profound.

“It is extremely likely that human influence on climate caused more than half of the observed increase in global average surface temperature from 1951 to 2010,” the draft report says. “There is high confidence that this has warmed the ocean, melted snow and ice, raised global mean sea level, and changed some climate extremes in the second half of the 20th century.”

The “extremely likely” language is stronger than in the last major United Nations report, published in 2007, and it means the authors of the draft document are now 95 percent to 100 percent confident that human activity is the primary influence on planetary warming. In the 2007 report, they said they were 90 percent to 100 percent certain on that issue.

On another closely watched issue, however, the authors retreated slightly from their 2007 position.

On the question of how much the planet could warm if carbon dioxide levels in the atmosphere doubled, the previous report had largely ruled out any number below 3.6 degrees Fahrenheit. The new draft says the rise could be as low as 2.7 degrees, essentially restoring a scientific consensus that prevailed from 1979 to 2007.

Most scientists see only an outside chance that the warming will be as low as either of those numbers, with the published evidence suggesting that an increase above 5 degrees Fahrenheit is likely if carbon dioxide doubles.

The new document is not final and will not become so until an intensive, closed-door negotiating session among scientists and government leaders in Stockholm in late September. But if the past is any guide, most of the core findings of the document will survive that final review.

The document was leaked over the weekend after it was sent to a large group of people who had signed up to review it. It was first reported on in detail by the Reuters news agency, and The New York Times obtained a copy independently to verify its contents.

It was prepared by the Intergovernmental Panel on Climate Change, a large, international group of scientists appointed by the United Nations. The group does no original research, but instead periodically assesses and summarizes the published scientific literature on climate change.

“The text is likely to change in response to comments from governments received in recent weeks and will also be considered by governments and scientists at a four-day approval session at the end of September,” the panel’s spokesman, Jonathan Lynn, said in a statement Monday. “It is therefore premature and could be misleading to attempt to draw conclusions from it.”

The intergovernmental panel won the Nobel Peace Prize along with Al Gore in 2007 for seeking to educate the world’s citizens about the risks of global warming. But it has also become a political target for climate contrarians, who helped identify several minor errors in the last big report from 2007. This time, the group adopted rigorous procedures in hopes of preventing such mistakes.

On sea level, one of the biggest single worries about climate change, the new report goes well beyond the one from 2007, which largely sidestepped the question of how much the ocean could rise this century.

The new report lays out several scenarios. In the most optimistic, the world’s governments would prove far more successful at getting emissions under control than they have been in the recent past, helping to limit the total warming.

In that circumstance, sea level could be expected to rise as little as 10 inches by the end of the century, the report found. That is a bit more than the eight-inch rise in the 20th century, which proved manageable even though it caused severe erosion along the world’s shorelines.

Read the entire article here.

Image courtesy of the Telegraph.

MondayMap: New Jersey Under Water

We love maps here at theDiagonal. So much so that we’ve begun a new feature: MondayMap. As the name suggests, we plan to feature fascinating new maps on Mondays. For our readers who prefer their plots served up on a Saturday, sorry. Usually we like to highlight maps that cause us to look at our world differently or provide a degree of welcome amusement, such as the wonderful trove of maps over at Strange Maps curated by Frank Jacobs.

However, this first MondayMap is a little different and serious. It’s an interactive map that shows the impact of estimated sea level rise on the streets of New Jersey. Obviously, such a tool would be a great boon for emergency services and urban planners. For the rest of us, whether we live in New Jersey or not, maps like this one — of extreme weather events and projections — are likely to become much more common over the coming decades. Kudos to researchers at Rutgers University for developing the NJ Flood Mapper.

[div class=attrib]From Wall Street Journal:[end-div]

While superstorm Sandy revealed the Northeast’s vulnerability, a new map by New Jersey scientists suggests how rising seas could make future storms even worse.

The map shows ocean waters surging more than a mile into communities along Raritan Bay, engulfing nearly all of New Jersey’s barrier islands and covering northern sections of the New Jersey Turnpike and land surrounding the Port Newark Container Terminal.

Such damage could occur under a scenario in which sea levels rise 6 feet—or a 3-foot rise in tandem with a powerful coastal storm, according to the map produced by Rutgers University researchers.

The satellite-based tool, one of the first comprehensive, state-specific maps of its kind, uses a Google-maps-style interface that allows viewers to zoom into street-level detail.

“We are not trying to unduly frighten people,” said Rick Lathrop, director of the Grant F. Walton Center for Remote Sensing and Spatial Analysis at Rutgers, who led the map’s development. “This is providing people a look at where our vulnerability is.”

Still, the implications of the Rutgers project unnerve residents of Surf City, on Long Beach Island, where the map shows water pouring over nearly all of the barrier island’s six municipalities with a 6-foot increase in sea levels.

“The water is going to come over the island and there will be no island,” said Barbara Epstein, a 73-year-old resident of nearby Barnegat Light, who added that she is considering moving after 12 years there. “The storms are worsening.”

To be sure, not everyone agrees that climate change will make sea-level rise more pronounced.

Politically, climate change remains an issue of debate. New York Gov. Andrew Cuomo has said Sandy showed the need to address the issue, while New Jersey Gov. Chris Christie has declined to comment on whether Sandy was linked to climate change.

Scientists have gone ahead and started to map sea-level-rise scenarios in New Jersey, New York City and flood-prone communities along the Gulf of Mexico to help guide local development and planning.

Sea levels have risen by 1.3 feet near Atlantic City and 0.9 feet by Battery Park between 1911 and 2006, according to data from the National Oceanic and Atmospheric Administration.

A serious storm could add at least another 3 feet, with historic storm surges—Sandy-scale—registering at 9 feet. So when planning for future coastal flooding, 6 feet or higher isn’t far-fetched when combining sea-level rise with high tides and storm surges, Mr. Lathrop said.

NOAA estimated in December that increasing ocean temperatures could cause sea levels to rise by 1.6 feet in 100 years, and by 3.9 feet if considering some level of Arctic ice-sheet melt.

Such an increase amounts to 0.16 inches per year, but the eventual impact could mean that a small storm could “do the same damage that Sandy did,” said Peter Howd, co-author of a 2012 U.S. Geological Survey report that found the rate of sea level rise had increased in the northeast.

[div class=attrib]Read the entire article after the jump.[end-div]

[div class=attrib]Image: NJ Flood Mapper. Courtesy of Grant F. Walton Center for Remote Sensing and Spatial Analysis (CRSSA), Rutgers University, in partnership with the Jacques Cousteau National Estuarine Research Reserve (JCNERR), and in collaboration with the NOAA Coastal Services Center (CSC).[end-div]

The North Continues to Melt Away

On July 16, 2012 the Petermann Glacier in Greenland calved another gigantic island of ice, about twice the size of Manhattan in New York, or about 46 square miles. Climatologists armed with NASA satellite imagery have been following the glacier for many years, and first spotted the break-off point around 8 years ago. The Petermann Glacier calved a previous huge iceberg, twice this size, in 2010.

According to NASA average temperatures in northern Greenland and the Canadian Arctic have increased by about 4 degrees Fahrenheit in the last 30 years.

So, driven by climate change or not, regardless of whether it is short-term or long-term, temporary or irreversible, man-made or a natural cycle, the trend is clear — the Arctic is warming, the ice cap is shrinking and sea-levels are rising.

[div class=attrib]From the Economist:[end-div]

STANDING ON THE Greenland ice cap, it is obvious why restless modern man so reveres wild places. Everywhere you look, ice draws the eye, squeezed and chiselled by a unique coincidence of forces. Gormenghastian ice ridges, silver and lapis blue, ice mounds and other frozen contortions are minutely observable in the clear Arctic air. The great glaciers impose order on the icy sprawl, flowing down to a semi-frozen sea.

The ice cap is still, frozen in perturbation. There is not a breath of wind, no engine’s sound, no bird’s cry, no hubbub at all. Instead of noise, there is its absence. You feel it as a pressure behind the temples and, if you listen hard, as a phantom roar. For generations of frosty-whiskered European explorers, and still today, the ice sheet is synonymous with the power of nature.

The Arctic is one of the world’s least explored and last wild places. Even the names of its seas and rivers are unfamiliar, though many are vast. Siberia’s Yenisey and Lena each carries more water to the sea than the Mississippi or the Nile. Greenland, the world’s biggest island, is six times the size of Germany. Yet it has a population of just 57,000, mostly Inuit scattered in tiny coastal settlements. In the whole of the Arctic—roughly defined as the Arctic Circle and a narrow margin to the south (see map)—there are barely 4m people, around half of whom live in a few cheerless post-Soviet cities such as Murmansk and Magadan. In most of the rest, including much of Siberia, northern Alaska, northern Canada, Greenland and northern Scandinavia, there is hardly anyone. Yet the region is anything but inviolate.

Fast forward

A heat map of the world, colour-coded for temperature change, shows the Arctic in sizzling maroon. Since 1951 it has warmed roughly twice as much as the global average. In that period the temperature in Greenland has gone up by 1.5°C, compared with around 0.7°C globally. This disparity is expected to continue. A 2°C increase in global temperatures—which appears inevitable as greenhouse-gas emissions soar—would mean Arctic warming of 3-6°C.

Almost all Arctic glaciers have receded. The area of Arctic land covered by snow in early summer has shrunk by almost a fifth since 1966. But it is the Arctic Ocean that is most changed. In the 1970s, 80s and 90s the minimum extent of polar pack ice fell by around 8% per decade. Then, in 2007, the sea ice crashed, melting to a summer minimum of 4.3m sq km (1.7m square miles), close to half the average for the 1960s and 24% below the previous minimum, set in 2005. This left the north-west passage, a sea lane through Canada’s 36,000-island Arctic Archipelago, ice-free for the first time in memory.

Scientists, scrambling to explain this, found that in 2007 every natural variation, including warm weather, clear skies and warm currents, had lined up to reinforce the seasonal melt. But last year there was no such remarkable coincidence: it was as normal as the Arctic gets these days. And the sea ice still shrank to almost the same extent.

There is no serious doubt about the basic cause of the warming. It is, in the Arctic as everywhere, the result of an increase in heat-trapping atmospheric gases, mainly carbon dioxide released when fossil fuels are burned. Because the atmosphere is shedding less solar heat, it is warming—a physical effect predicted back in 1896 by Svante Arrhenius, a Swedish scientist. But why is the Arctic warming faster than other places?

Consider, first, how very sensitive to temperature change the Arctic is because of where it is. In both hemispheres the climate system shifts heat from the steamy equator to the frozen pole. But in the north the exchange is much more efficient. This is partly because of the lofty mountain ranges of Europe, Asia and America that help mix warm and cold fronts, much as boulders churn water in a stream. Antarctica, surrounded by the vast southern seas, is subject to much less atmospheric mixing.

The land masses that encircle the Arctic also prevent the polar oceans revolving around it as they do around Antarctica. Instead they surge, north-south, between the Arctic land masses in a gigantic exchange of cold and warm water: the Pacific pours through the Bering Strait, between Siberia and Alaska, and the Atlantic through the Fram Strait, between Greenland and Norway’s Svalbard archipelago.

That keeps the average annual temperature for the high Arctic (the northernmost fringes of land and the sea beyond) at a relatively sultry -15°C; much of the rest is close to melting-point for much of the year. Even modest warming can therefore have a dramatic effect on the region’s ecosystems. The Antarctic is also warming, but with an average annual temperature of -57°C it will take more than a few hot summers for this to become obvious.

[div class=attrib]Read the entire article following the jump.[end-div]

[div class=attrib]Image: Sequence of three images showing the Petermann Glacier sliding toward the sea along the northwestern coast of Greenland, terminating in a huge, new floating ice island. Courtesy: NASA.[end-div]

King Canute or Mother Nature in North Carolina, Virginia, Texas?

Legislators in North Carolina recently went one better than King C’Nut (Canute). The king of Denmark, England, Norway and parts of Sweden during various periods between 1018 and 1035, famously and unsuccessfully tried to hold back the incoming tide. The now mythic story tells of Canute’s arrogance. Not to be outdone, North Carolina’s state legislature recently passed a law that bans state agencies from reporting that sea-level rise is accelerating.

The bill From North Carolina states:

“… rates shall only be determined using historical data, and these data shall be limited to the time period following the year 1900. Rates of sea-level rise may be extrapolated linearly to estimate future rates of rise but shall not include scenarios of accelerated rates of sea-level rise.”

This comes hot on the heals of the recent revisionist push in Virginia where references to phrases such as “sea level rise” and “climate change” are forbidden in official state communications. Last year of course, Texas led the way for other states following the climate science denial program when the Texas Commission on Environmental Quality, which had commissioned a scientific study of Galveston Bay, removed all references to “rising sea levels”.

For more detailed reporting on this unsurprising and laughable state of affairs check out this article at Skeptical Science.

[div class=attrib]From Scientific American:[end-div]

Less than two weeks after the state’s senate passed a climate science-squelching bill, research shows that sea level along the coast between N.C. and Massachusetts is rising faster than anywhere on Earth.

Could nature be mocking North Carolina’s law-makers? Less than two weeks after the state’s senate passed a bill banning state agencies from reporting that sea-level rise is accelerating, research has shown that the coast between North Carolina and Massachusetts is experiencing the fastest sea-level rise in the world.

Asbury Sallenger, an oceanographer at the US Geological Survey in St Petersburg, Florida, and his colleagues analysed tide-gauge records from around North America. On 24 June, they reported in Nature Climate Change that since 1980, sea-level rise between Cape Hatteras, North Carolina, and Boston, Massachusetts, has accelerated to between 2 and 3.7 millimetres per year. That is three to four times the global average, and it means the coast could see 20–29 centimetres of sea-level rise on top of the metre predicted for the world as a whole by 2100 ( A. H. Sallenger Jr et al. Nature Clim. Change http://doi.org/hz4; 2012).

“Many people mistakenly think that the rate of sea-level rise is the same everywhere as glaciers and ice caps melt,” says Marcia McNutt, director of the US Geological Survey. But variations in currents and land movements can cause large regional differences. The hotspot is consistent with the slowing measured in Atlantic Ocean circulation, which may be tied to changes in water temperature, salinity and density.

North Carolina’s senators, however, have tried to stop state-funded researchers from releasing similar reports. The law approved by the senate on 12 June banned scientists in state agencies from using exponential extrapolation to predict sea-level rise, requiring instead that they stick to linear projections based on historical data.

Following international opprobrium, the state’s House of Representatives rejected the bill on 19 June. However, a compromise between the house and the senate forbids state agencies from basing any laws or plans on exponential extrapolations for the next three to four years, while the state conducts a new sea-level study.

According to local media, the bill was the handiwork of industry lobbyists and coastal municipalities who feared that investors and property developers would be scared off by predictions of high sea-level rises. The lobbyists invoked a paper published in the Journal of Coastal Research last year by James Houston, retired director of the US Army Corps of Engineers’ research centre in Vicksburg, Mississippi, and Robert Dean, emeritus professor of coastal engineering at the University of Florida in Gainesville. They reported that global sea-level rise has slowed since 1930 ( J. R. Houston and R. G. Dean J. Coastal Res. 27 , 409 – 417 ; 2011) — a contention that climate sceptics around the world have seized on.

Speaking to Nature, Dean accused the oceanographic community of ideological bias. “In the United States, there is an overemphasis on unrealistically high sea-level rise,” he says. “The reason is budgets. I am retired, so I have the freedom to report what I find without any bias or need to chase funding.” But Sallenger says that Houston and Dean’s choice of data sets masks acceleration in the sea-level-rise hotspot.

[div class=attrib]Read the entire article after the jump.[end-div]

[div class=attrib]Image courtesy of Policymic.[end-div]