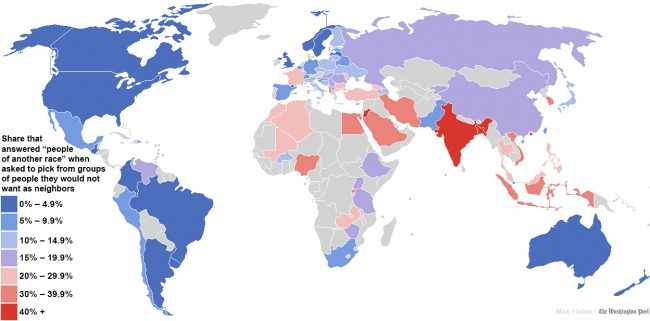
Following on from last week’s MondayMap post on intolerance and hatred within the United States — according to tweets on the social media site Twitter — we expand our view this week to cover the globe. This map is a based on a more detailed, global research study of people’s attitudes to having neighbors of a different race.
From the Washington Post:
When two Swedish economists set out to examine whether economic freedom made people any more or less racist, they knew how they would gauge economic freedom, but they needed to find a way to measure a country’s level of racial tolerance. So they turned to something called the World Values Survey, which has been measuring global attitudes and opinions for decades.
Among the dozens of questions that World Values asks, the Swedish economists found one that, they believe, could be a pretty good indicator of tolerance for other races. The survey asked respondents in more than 80 different countries to identify kinds of people they would not want as neighbors. Some respondents, picking from a list, chose “people of a different race.” The more frequently that people in a given country say they don’t want neighbors from other races, the economists reasoned, the less racially tolerant you could call that society. (The study concluded that economic freedom had no correlation with racial tolerance, but it does appear to correlate with tolerance toward homosexuals.)
Unfortunately, the Swedish economists did not include all of the World Values Survey data in their final research paper. So I went back to the source, compiled the original data and mapped it out on the infographic above. In the bluer countries, fewer people said they would not want neighbors of a different race; in red countries, more people did.
If we treat this data as indicative of racial tolerance, then we might conclude that people in the bluer countries are the least likely to express racist attitudes, while the people in red countries are the most likely.
Update: Compare the results to this map of the world’s most and least diverse countries.
Before we dive into the data, a couple of caveats. First, it’s entirely likely that some people lied when answering this question; it would be surprising if they hadn’t. But the operative question, unanswerable, is whether people in certain countries were more or less likely to answer the question honestly. For example, while the data suggest that Swedes are more racially tolerant than Finns, it’s possible that the two groups are equally tolerant but that Finns are just more honest. The willingness to state such a preference out loud, though, might be an indicator of racial attitudes in itself. Second, the survey is not conducted every year; some of the results are very recent and some are several years old, so we’re assuming the results are static, which might not be the case.
• Anglo and Latin countries most tolerant. People in the survey were most likely to embrace a racially diverse neighbor in the United Kingdom and its Anglo former colonies (the United States, Canada, Australia and New Zealand) and in Latin America. The only real exceptions were oil-rich Venezuela, where income inequality sometimes breaks along racial lines, and the Dominican Republic, perhaps because of its adjacency to troubled Haiti. Scandinavian countries also scored high.
• India, Jordan, Bangladesh and Hong Kong by far the least tolerant. In only three of 81 surveyed countries, more than 40 percent of respondents said they would not want a neighbor of a different race. This included 43.5 percent of Indians, 51.4 percent of Jordanians and an astonishingly high 71.8 percent of Hong Kongers and 71.7 percent of Bangladeshis.
Read more about this map here.

