Category Archives: Environs

Extreme Weather as the New Norm

Melting glaciers at the poles, wildfires in the western United States, severe flooding across Europe and parts of Asia, hurricanes in northern Australia, warmer temperatures across the globe. According to a many climatologists, including a growing number of ex-climate change skeptics, this is the new normal for our foreseeable future. Welcome to the changed climate.

[div class=attrib]From the New York Times:[end-div]

BY many measurements, this summer’s drought is one for the record books. But so was last year’s drought in the South Central states. And it has been only a decade since an extreme five-year drought hit the American West. Widespread annual droughts, once a rare calamity, have become more frequent and are set to become the “new normal.”

Until recently, many scientists spoke of climate change mainly as a “threat,” sometime in the future. But it is increasingly clear that we already live in the era of human-induced climate change, with a growing frequency of weather and climate extremes like heat waves, droughts, floods and fires.

Future precipitation trends, based on climate model projections for the coming fifth assessment from the Intergovernmental Panel on Climate Change, indicate that droughts of this length and severity will be commonplace through the end of the century unless human-induced carbon emissions are significantly reduced. Indeed, assuming business as usual, each of the next 80 years in the American West is expected to see less rainfall than the average of the five years of the drought that hit the region from 2000 to 2004.

That extreme drought (which we have analyzed in a new study in the journal Nature-Geoscience) had profound consequences for carbon sequestration, agricultural productivity and water resources: plants, for example, took in only half the carbon dioxide they do normally, thanks to a drought-induced drop in photosynthesis.

In the drought’s worst year, Western crop yields were down by 13 percent, with many local cases of complete crop failure. Major river basins showed 5 percent to 50 percent reductions in flow. These reductions persisted up to three years after the drought ended, because the lakes and reservoirs that feed them needed several years of average rainfall to return to predrought levels.

In terms of severity and geographic extent, the 2000-4 drought in the West exceeded such legendary events as the Dust Bowl of the 1930s. While that drought saw intervening years of normal rainfall, the years of the turn-of-the-century drought were consecutive. More seriously still, long-term climate records from tree-ring chronologies show that this drought was the most severe event of its kind in the western United States in the past 800 years. Though there have been many extreme droughts over the last 1,200 years, only three other events have been of similar magnitude, all during periods of “megadroughts.”

Most frightening is that this extreme event could become the new normal: climate models point to a warmer planet, largely because of greenhouse gas emissions. Planetary warming, in turn, is expected to create drier conditions across western North America, because of the way global-wind and atmospheric-pressure patterns shift in response.

Indeed, scientists see signs of the relationship between warming and drought in western North America by analyzing trends over the last 100 years; evidence suggests that the more frequent drought and low precipitation events observed for the West during the 20th century are associated with increasing temperatures across the Northern Hemisphere.

These climate-model projections suggest that what we consider today to be an episode of severe drought might even be classified as a period of abnormal wetness by the end of the century and that a coming megadrought — a prolonged, multidecade period of significantly below-average precipitation — is possible and likely in the American West.

[div class=attrib]Read the entire article after the jump.[end-div]

[div class=attrib]Image courtesy of the Sun.[end-div]

A Climate Change Skeptic Recants

A climate change skeptic recants. Of course, disbelievers in human-influenced climate change will point to the fact that physicist Richard Muller used an op-ed in the New York Times as evidence of flagrant falsehood and unmitigated bias.

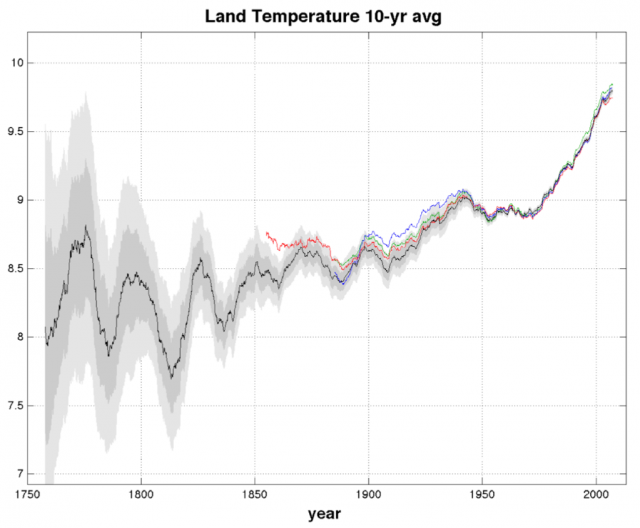
Several years ago Muller set up the Berkeley Earth project, to collect and analyze land-surface temperature records from sources independent of NASA and NOAA. Convinced, at the time, that climate change researchers had the numbers all wrong, Muller and team set out to find the proof.

[div class=attrib]From the New York Times:[end-div]

CALL me a converted skeptic. Three years ago I identified problems in previous climate studies that, in my mind, threw doubt on the very existence of global warming. Last year, following an intensive research effort involving a dozen scientists, I concluded that global warming was real and that the prior estimates of the rate of warming were correct. I’m now going a step further: Humans are almost entirely the cause.

My total turnaround, in such a short time, is the result of careful and objective analysis by the Berkeley Earth Surface Temperature project, which I founded with my daughter Elizabeth. Our results show that the average temperature of the earth’s land has risen by two and a half degrees Fahrenheit over the past 250 years, including an increase of one and a half degrees over the most recent 50 years. Moreover, it appears likely that essentially all of this increase results from the human emission of greenhouse gases.

These findings are stronger than those of the Intergovernmental Panel on Climate Change, the United Nations group that defines the scientific and diplomatic consensus on global warming. In its 2007 report, the I.P.C.C. concluded only that most of the warming of the prior 50 years could be attributed to humans. It was possible, according to the I.P.C.C. consensus statement, that the warming before 1956 could be because of changes in solar activity, and that even a substantial part of the more recent warming could be natural.

Our Berkeley Earth approach used sophisticated statistical methods developed largely by our lead scientist, Robert Rohde, which allowed us to determine earth land temperature much further back in time. We carefully studied issues raised by skeptics: biases from urban heating (we duplicated our results using rural data alone), from data selection (prior groups selected fewer than 20 percent of the available temperature stations; we used virtually 100 percent), from poor station quality (we separately analyzed good stations and poor ones) and from human intervention and data adjustment (our work is completely automated and hands-off). In our papers we demonstrate that none of these potentially troublesome effects unduly biased our conclusions.

The historic temperature pattern we observed has abrupt dips that match the emissions of known explosive volcanic eruptions; the particulates from such events reflect sunlight, make for beautiful sunsets and cool the earth’s surface for a few years. There are small, rapid variations attributable to El Niño and other ocean currents such as the Gulf Stream; because of such oscillations, the “flattening” of the recent temperature rise that some people claim is not, in our view, statistically significant. What has caused the gradual but systematic rise of two and a half degrees? We tried fitting the shape to simple math functions (exponentials, polynomials), to solar activity and even to rising functions like world population. By far the best match was to the record of atmospheric carbon dioxide, measured from atmospheric samples and air trapped in polar ice.

Just as important, our record is long enough that we could search for the fingerprint of solar variability, based on the historical record of sunspots. That fingerprint is absent. Although the I.P.C.C. allowed for the possibility that variations in sunlight could have ended the “Little Ice Age,” a period of cooling from the 14th century to about 1850, our data argues strongly that the temperature rise of the past 250 years cannot be attributed to solar changes. This conclusion is, in retrospect, not too surprising; we’ve learned from satellite measurements that solar activity changes the brightness of the sun very little.

How definite is the attribution to humans? The carbon dioxide curve gives a better match than anything else we’ve tried. Its magnitude is consistent with the calculated greenhouse effect — extra warming from trapped heat radiation. These facts don’t prove causality and they shouldn’t end skepticism, but they raise the bar: to be considered seriously, an alternative explanation must match the data at least as well as carbon dioxide does. Adding methane, a second greenhouse gas, to our analysis doesn’t change the results. Moreover, our analysis does not depend on large, complex global climate models, the huge computer programs that are notorious for their hidden assumptions and adjustable parameters. Our result is based simply on the close agreement between the shape of the observed temperature rise and the known greenhouse gas increase.

It’s a scientist’s duty to be properly skeptical. I still find that much, if not most, of what is attributed to climate change is speculative, exaggerated or just plain wrong. I’ve analyzed some of the most alarmist claims, and my skepticism about them hasn’t changed.

[div class=attrib]Read the entire article following the jump.[end-div]

[div class=attrib]Image: Global land-surface temperature with a 10-year moving average. Courtesy of Berkeley Earth.[end-div]

Best Countries for Women

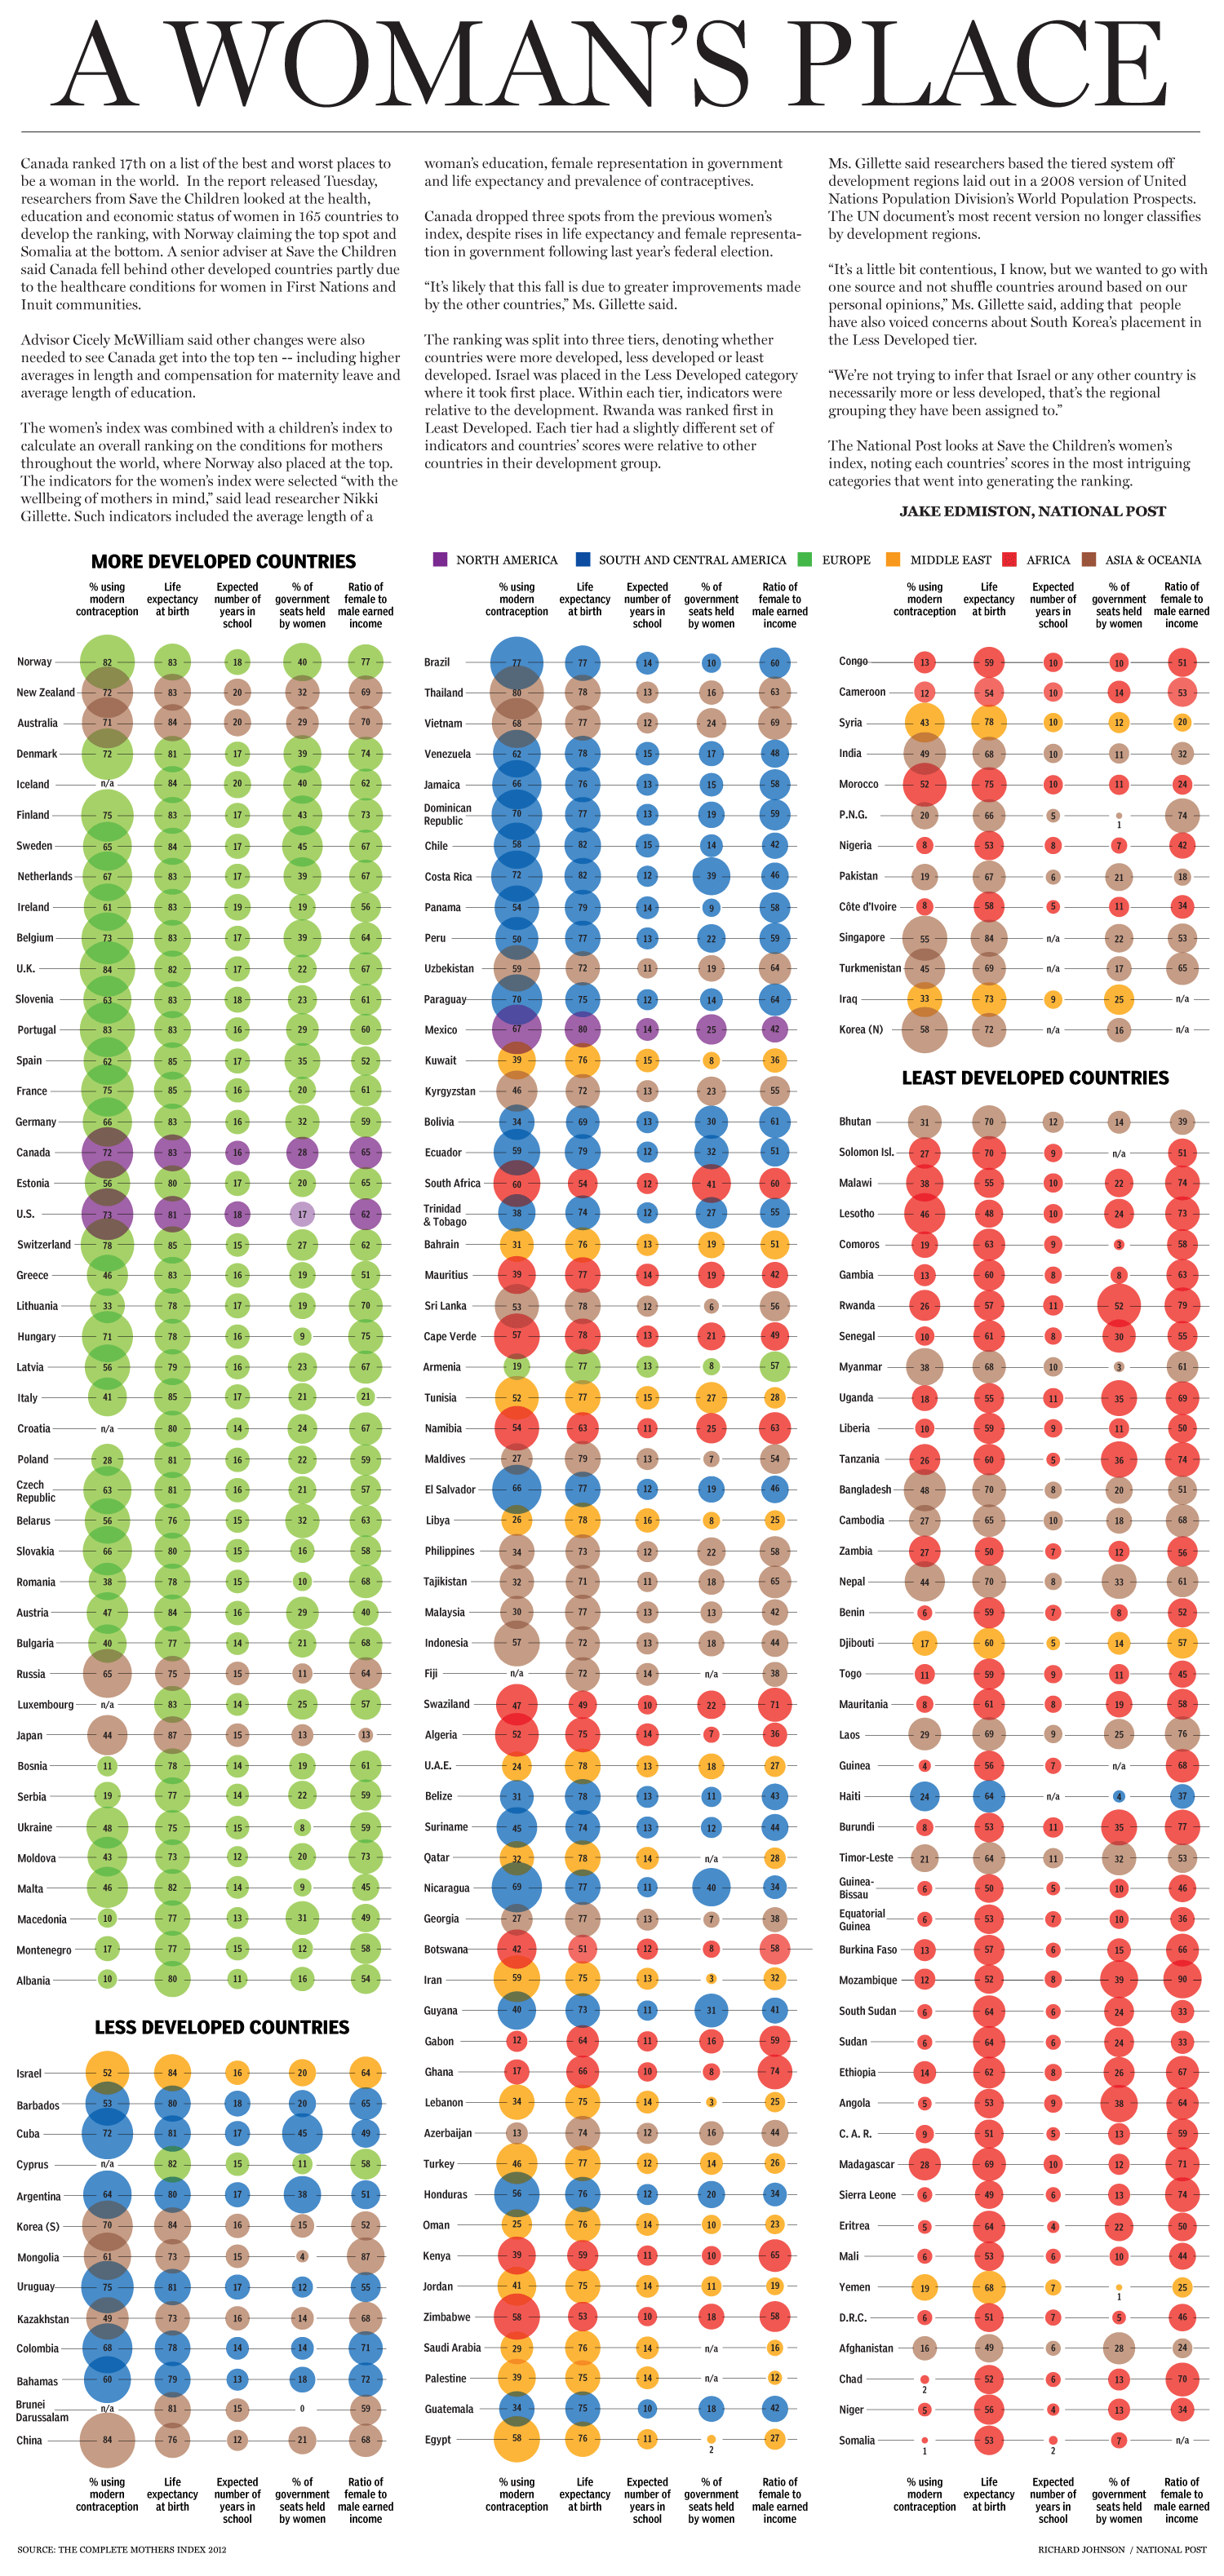
If you’re female and value lengthy life expectancy, comprehensive reproductive health services, sound education and equality with males, where should you live? In short, Scandinavia, Australia and New Zealand, and Northern Europe. In a list of the 44 most well-developed nations, the United States ranks towards the middle, just below Canada and Estonia, but above Greece, Italy, Russia and most of Central and Eastern Europe.

The fascinating infographic from the National Post does a great job of summarizing the current state of womens’ affairs from data gathered from 165 countries.

[div class=attrib]Read the entire article and find a higher quality infographic after the jump.[end-div]

Two Degrees

Author and environmentalist Bill McKibben has been writing about climate change and environmental issues for over 20 years. His first book, The End of Nature, was published in 1989, and is considered to be the first book aimed at the general public on the subject of climate change.

In his latest essay in Rolling Stone, which we excerpt below, McKibben offers a sobering assessment based on our current lack of action on a global scale. He argues that in the face of governmental torpor, and with individual action being almost inconsequential (at this late stage), only a radical re-invention of our fossil-fuel industries — to energy companies in the broad sense — can bring significant and lasting change.

Learn more about Bill McKibben, here.

[div class=attrib]From Rolling Stone:[end-div]

If the pictures of those towering wildfires in Colorado haven’t convinced you, or the size of your AC bill this summer, here are some hard numbers about climate change: June broke or tied 3,215 high-temperature records across the United States. That followed the warmest May on record for the Northern Hemisphere – the 327th consecutive month in which the temperature of the entire globe exceeded the 20th-century average, the odds of which occurring by simple chance were 3.7 x 10-99, a number considerably larger than the number of stars in the universe.

Meteorologists reported that this spring was the warmest ever recorded for our nation – in fact, it crushed the old record by so much that it represented the “largest temperature departure from average of any season on record.” The same week, Saudi authorities reported that it had rained in Mecca despite a temperature of 109 degrees, the hottest downpour in the planet’s history.

Not that our leaders seemed to notice. Last month the world’s nations, meeting in Rio for the 20th-anniversary reprise of a massive 1992 environmental summit, accomplished nothing. Unlike George H.W. Bush, who flew in for the first conclave, Barack Obama didn’t even attend. It was “a ghost of the glad, confident meeting 20 years ago,” the British journalist George Monbiot wrote; no one paid it much attention, footsteps echoing through the halls “once thronged by multitudes.” Since I wrote one of the first books for a general audience about global warming way back in 1989, and since I’ve spent the intervening decades working ineffectively to slow that warming, I can say with some confidence that we’re losing the fight, badly and quickly – losing it because, most of all, we remain in denial about the peril that human civilization is in.

When we think about global warming at all, the arguments tend to be ideological, theological and economic. But to grasp the seriousness of our predicament, you just need to do a little math. For the past year, an easy and powerful bit of arithmetical analysis first published by financial analysts in the U.K. has been making the rounds of environmental conferences and journals, but it hasn’t yet broken through to the larger public. This analysis upends most of the conventional political thinking about climate change. And it allows us to understand our precarious – our almost-but-not-quite-finally hopeless – position with three simple numbers.

The First Number: 2° Celsius

If the movie had ended in Hollywood fashion, the Copenhagen climate conference in 2009 would have marked the culmination of the global fight to slow a changing climate. The world’s nations had gathered in the December gloom of the Danish capital for what a leading climate economist, Sir Nicholas Stern of Britain, called the “most important gathering since the Second World War, given what is at stake.” As Danish energy minister Connie Hedegaard, who presided over the conference, declared at the time: “This is our chance. If we miss it, it could take years before we get a new and better one. If ever.”

In the event, of course, we missed it. Copenhagen failed spectacularly. Neither China nor the United States, which between them are responsible for 40 percent of global carbon emissions, was prepared to offer dramatic concessions, and so the conference drifted aimlessly for two weeks until world leaders jetted in for the final day. Amid considerable chaos, President Obama took the lead in drafting a face-saving “Copenhagen Accord” that fooled very few. Its purely voluntary agreements committed no one to anything, and even if countries signaled their intentions to cut carbon emissions, there was no enforcement mechanism. “Copenhagen is a crime scene tonight,” an angry Greenpeace official declared, “with the guilty men and women fleeing to the airport.” Headline writers were equally brutal: COPENHAGEN: THE MUNICH OF OUR TIMES? asked one.

The accord did contain one important number, however. In Paragraph 1, it formally recognized “the scientific view that the increase in global temperature should be below two degrees Celsius.” And in the very next paragraph, it declared that “we agree that deep cuts in global emissions are required… so as to hold the increase in global temperature below two degrees Celsius.” By insisting on two degrees – about 3.6 degrees Fahrenheit – the accord ratified positions taken earlier in 2009 by the G8, and the so-called Major Economies Forum. It was as conventional as conventional wisdom gets. The number first gained prominence, in fact, at a 1995 climate conference chaired by Angela Merkel, then the German minister of the environment and now the center-right chancellor of the nation.

Some context: So far, we’ve raised the average temperature of the planet just under 0.8 degrees Celsius, and that has caused far more damage than most scientists expected. (A third of summer sea ice in the Arctic is gone, the oceans are 30 percent more acidic, and since warm air holds more water vapor than cold, the atmosphere over the oceans is a shocking five percent wetter, loading the dice for devastating floods.) Given those impacts, in fact, many scientists have come to think that two degrees is far too lenient a target. “Any number much above one degree involves a gamble,” writes Kerry Emanuel of MIT, a leading authority on hurricanes, “and the odds become less and less favorable as the temperature goes up.” Thomas Lovejoy, once the World Bank’s chief biodiversity adviser, puts it like this: “If we’re seeing what we’re seeing today at 0.8 degrees Celsius, two degrees is simply too much.” NASA scientist James Hansen, the planet’s most prominent climatologist, is even blunter: “The target that has been talked about in international negotiations for two degrees of warming is actually a prescription for long-term disaster.” At the Copenhagen summit, a spokesman for small island nations warned that many would not survive a two-degree rise: “Some countries will flat-out disappear.” When delegates from developing nations were warned that two degrees would represent a “suicide pact” for drought-stricken Africa, many of them started chanting, “One degree, one Africa.”

Despite such well-founded misgivings, political realism bested scientific data, and the world settled on the two-degree target – indeed, it’s fair to say that it’s the only thing about climate change the world has settled on. All told, 167 countries responsible for more than 87 percent of the world’s carbon emissions have signed on to the Copenhagen Accord, endorsing the two-degree target. Only a few dozen countries have rejected it, including Kuwait, Nicaragua and Venezuela. Even the United Arab Emirates, which makes most of its money exporting oil and gas, signed on. The official position of planet Earth at the moment is that we can’t raise the temperature more than two degrees Celsius – it’s become the bottomest of bottom lines. Two degrees.

[div class=attrib]Read the entire article after the jump.[end-div]

[div class=attrib]Image: Emissions from industry have helped increase the levels of carbon dioxide in the atmosphere, driving climate change. Courtesy of New Scientist / Eye Ubiquitous / Rex Features.[end-div]

Your Life Expectancy Mapped

Your life expectancy mapped, that is, if you live in London, U.K. So, take the iconic London tube (subway) map, then overlay it with figures for average life expectancy. Voila, you get to see how your neighbors on the Piccadilly Line fair in their longevity compared with say, you, who happen to live near a Central Line station. It turns out that in some cases adjacent areas — as depicted by nearby but different subway stations — show an astounding gap of more than 20 years in projected life span.

So, what is at work? And, more importantly, should you move to Bond Street where the average life expectancy is 96 years, versus only 79 in Kennington, South London?

[div class=attrib]From the Atlantic:[end-div]

Last year’s dystopian action flick In Time has Justin Timberlake playing a street rat who suddenly comes into a great deal of money — only the currency isn’t cash, it’s time. Hours and minutes of Timberlake’s life that can be traded just like dollars and cents in our world. Moving from poor districts to rich ones, and vice versa, requires Timberlake to pay a toll, each time shaving off a portion of his life savings.

Literally paying with your life just to get around town seems like — you guessed it — pure science fiction. It’s absolute baloney to think that driving or taking a crosstown bus could result in a shorter life (unless you count this). But a project by University College London researchers called Lives on the Line echoes something similar with a map that plots local differences in life expectancy based on the nearest Tube stop.

The trends are largely unsurprising, and correlate mostly with wealth. Britons living in the ritzier West London tend to have longer expected lifespans compared to those who live in the east or the south. Those residing near the Oxford Circus Tube stop have it the easiest, with an average life expectancy of 96 years. Going into less wealthy neighborhoods in south and east London, life expectancy begins to drop — though it still hovers in the respectable range of 78-79.

Meanwhile, differences in life expectancy between even adjacent stations can be stark. Britons living near Pimlico are predicted to live six years longer than those just across the Thames near Vauxhall. There’s about a two-decade difference between those living in central London compared to those near some stations on the Docklands Light Railway, according to the BBC. Similarly, moving from Tottenham Court Road to Holborn will also shave six years off the Londoner’s average life expectancy.

Michael Marmot, a UCL professor who wasn’t involved in the project, put the numbers in international perspective.

“The difference between Hackney and the West End,” Marmot told the BBC, “is the same as the difference between England and Guatemala in terms of life expectancy.”

[div class=atrib]Read the entire article after the jump.[end-div]

[div class=attrib]Image courtesy of Atlantic / MappingLondon.co.uk.[end-div]

The North Continues to Melt Away

On July 16, 2012 the Petermann Glacier in Greenland calved another gigantic island of ice, about twice the size of Manhattan in New York, or about 46 square miles. Climatologists armed with NASA satellite imagery have been following the glacier for many years, and first spotted the break-off point around 8 years ago. The Petermann Glacier calved a previous huge iceberg, twice this size, in 2010.

According to NASA average temperatures in northern Greenland and the Canadian Arctic have increased by about 4 degrees Fahrenheit in the last 30 years.

So, driven by climate change or not, regardless of whether it is short-term or long-term, temporary or irreversible, man-made or a natural cycle, the trend is clear — the Arctic is warming, the ice cap is shrinking and sea-levels are rising.

[div class=attrib]From the Economist:[end-div]

STANDING ON THE Greenland ice cap, it is obvious why restless modern man so reveres wild places. Everywhere you look, ice draws the eye, squeezed and chiselled by a unique coincidence of forces. Gormenghastian ice ridges, silver and lapis blue, ice mounds and other frozen contortions are minutely observable in the clear Arctic air. The great glaciers impose order on the icy sprawl, flowing down to a semi-frozen sea.

The ice cap is still, frozen in perturbation. There is not a breath of wind, no engine’s sound, no bird’s cry, no hubbub at all. Instead of noise, there is its absence. You feel it as a pressure behind the temples and, if you listen hard, as a phantom roar. For generations of frosty-whiskered European explorers, and still today, the ice sheet is synonymous with the power of nature.

The Arctic is one of the world’s least explored and last wild places. Even the names of its seas and rivers are unfamiliar, though many are vast. Siberia’s Yenisey and Lena each carries more water to the sea than the Mississippi or the Nile. Greenland, the world’s biggest island, is six times the size of Germany. Yet it has a population of just 57,000, mostly Inuit scattered in tiny coastal settlements. In the whole of the Arctic—roughly defined as the Arctic Circle and a narrow margin to the south (see map)—there are barely 4m people, around half of whom live in a few cheerless post-Soviet cities such as Murmansk and Magadan. In most of the rest, including much of Siberia, northern Alaska, northern Canada, Greenland and northern Scandinavia, there is hardly anyone. Yet the region is anything but inviolate.

Fast forward

A heat map of the world, colour-coded for temperature change, shows the Arctic in sizzling maroon. Since 1951 it has warmed roughly twice as much as the global average. In that period the temperature in Greenland has gone up by 1.5°C, compared with around 0.7°C globally. This disparity is expected to continue. A 2°C increase in global temperatures—which appears inevitable as greenhouse-gas emissions soar—would mean Arctic warming of 3-6°C.

Almost all Arctic glaciers have receded. The area of Arctic land covered by snow in early summer has shrunk by almost a fifth since 1966. But it is the Arctic Ocean that is most changed. In the 1970s, 80s and 90s the minimum extent of polar pack ice fell by around 8% per decade. Then, in 2007, the sea ice crashed, melting to a summer minimum of 4.3m sq km (1.7m square miles), close to half the average for the 1960s and 24% below the previous minimum, set in 2005. This left the north-west passage, a sea lane through Canada’s 36,000-island Arctic Archipelago, ice-free for the first time in memory.

Scientists, scrambling to explain this, found that in 2007 every natural variation, including warm weather, clear skies and warm currents, had lined up to reinforce the seasonal melt. But last year there was no such remarkable coincidence: it was as normal as the Arctic gets these days. And the sea ice still shrank to almost the same extent.

There is no serious doubt about the basic cause of the warming. It is, in the Arctic as everywhere, the result of an increase in heat-trapping atmospheric gases, mainly carbon dioxide released when fossil fuels are burned. Because the atmosphere is shedding less solar heat, it is warming—a physical effect predicted back in 1896 by Svante Arrhenius, a Swedish scientist. But why is the Arctic warming faster than other places?

Consider, first, how very sensitive to temperature change the Arctic is because of where it is. In both hemispheres the climate system shifts heat from the steamy equator to the frozen pole. But in the north the exchange is much more efficient. This is partly because of the lofty mountain ranges of Europe, Asia and America that help mix warm and cold fronts, much as boulders churn water in a stream. Antarctica, surrounded by the vast southern seas, is subject to much less atmospheric mixing.

The land masses that encircle the Arctic also prevent the polar oceans revolving around it as they do around Antarctica. Instead they surge, north-south, between the Arctic land masses in a gigantic exchange of cold and warm water: the Pacific pours through the Bering Strait, between Siberia and Alaska, and the Atlantic through the Fram Strait, between Greenland and Norway’s Svalbard archipelago.

That keeps the average annual temperature for the high Arctic (the northernmost fringes of land and the sea beyond) at a relatively sultry -15°C; much of the rest is close to melting-point for much of the year. Even modest warming can therefore have a dramatic effect on the region’s ecosystems. The Antarctic is also warming, but with an average annual temperature of -57°C it will take more than a few hot summers for this to become obvious.

[div class=attrib]Read the entire article following the jump.[end-div]

[div class=attrib]Image: Sequence of three images showing the Petermann Glacier sliding toward the sea along the northwestern coast of Greenland, terminating in a huge, new floating ice island. Courtesy: NASA.[end-div]

A Different Kind of Hotel

Bored of the annual family trip to Disneyland? Tired of staying in a suite hotel that still offers musak in the lobby, floral motifs on the walls, and ashtrays and saccharin packets next to the rickety minibar? Well, leaf through this list of 10 exotic and gorgeous hotels and start planning your next real escape today.

Wadi Rum Desert Lodge – The Valley of the Moon, Jordan.

[div class=attrib]From Flavorwire:[end-div]

A Backward Glance, Pulitzer Prize-winning author Edith Wharton’s gem of an autobiography is highbrow beach reading at its very best. In the memoir, she recalls time spent with her bff traveling buddy, Henry James, and quotes his arcadian proclamation, “summer afternoon — summer afternoon; to me those have always been the two most beautiful words in the English language.” Maybe so in the less than industrious heyday of inherited wealth, but in today’s world where most people work all day for a living, those two words just don’t have the same appeal as our two favorite words: summer getaway.

Like everyone else in our overworked and overheated city, rest and relaxation are all we can think about — especially on a hot Friday afternoon like this. In considering options for our celebrated summer respite, we thought we’d take a virtual gander to check out alternatives to the usual Hamptons summer share. From a treehouse where sloths join you for morning coffee to a giant sandcastle, click through to see some of the most unusual summer getaway destinations in the world.

[div class=attrib]See more stunning hotels after the jump.[end-div]

National Education Rankings: C-

One would believe that the most affluent and open country on the planet would have one of the best, if not the best, education systems. Yet, the United States of America distinguishes itself by being thoroughly mediocre in a ranking of developed nations in science, mathematics and reading. How can we makes amends for our children?

[div class=attrib]From Slate:[end-div]

Take the 2009 PISA test, which assessed the knowledge of students from 65 countries and economies—34 of which are members of the development organization the OECD, including the United States—in math, science, and reading. Of the OECD countries, the United States came in 17th place in science literacy; of all countries and economies surveyed, it came in 23rd place. The U.S. score of 502 practically matched the OECD average of 501. That puts us firmly in the middle. Where we don’t want to be.

What do the leading countries do differently? To find out, Slate asked science teachers from five countries that are among the world’s best in science education—Finland, Singapore, South Korea, New Zealand, and Canada—how they approach their subject and the classroom. Their recommendations: Keep students engaged and make the science seem relevant.

Finland: “To Make Students Enjoy Chemistry Is Hard Work”

Finland was first among the 34 OECD countries in the 2009 PISA science rankings and second—behind mainland China—among all 65 nations and economies that took the test. Ari Myllyviita teaches chemistry and works with future science educators at the Viikki Teacher Training School of Helsinki University.

Finland’s National Core Curriculum is premised on the idea “that learning is a result of a student’s active and focused actions aimed to process and interpret received information in interaction with other students, teachers and the environment and on the basis of his or her existing knowledge structures.”

My conception of learning lies strongly on this citation from our curriculum. My aim is to support knowledge-building, socioculturally: to create socially supported activity in student’s zone of proximal development (the area where student need some support to achieve next level of understanding or skill). The student’s previous knowledge is the starting point, and then the learning is bound to the activity during lessons—experiments, simulations, and observing phenomena.

The National Core Curriculum also states, “The purpose of instruction in chemistry is to support development of students’ scientific thinking and modern worldview.” Our teaching is based on examination and observations of substances and chemical phenomena, their structures and properties, and reactions between substances. Through experiments and theoretical models, students are taught to understand everyday life and nature. In my classroom, I use discussion, lectures, demonstrations, and experimental work—quite often based on group work. Between lessons, I use social media and other information communication technologies to stay in touch with students.

In addition to the National Core Curriculum, my school has its own. They have the same bases, but our own curriculum is more concrete. Based on these, I write my course and lesson plans. Because of different learning styles, I use different kinds of approaches, sometimes theoretical and sometimes experimental. Always there are new concepts and perhaps new models to explain the phenomena or results.

To make students enjoy learning chemistry is hard work. I think that as a teacher, you have to love your subject and enjoy teaching even when there are sometimes students who don´t pay attention to you. But I get satisfaction when I can give a purpose for the future by being a supportive teacher.

New Zealand: “Students Disengage When a Teacher Is Simply Repeating Facts or Ideas”

New Zealand came in seventh place out of 65 in the 2009 PISA assessment. Steve Martin is head of junior science at Howick College. In 2010, he received the prime minister’s award for science teaching.

Science education is an important part of preparing students for their role in the community. Scientific understanding will allow them to engage in issues that concern them now and in the future, such as genetically modified crops. In New Zealand, science is also viewed as having a crucial role to play in the future of the economic health of the country. This can be seen in the creation of the “Prime Minister’s Science Prizes,” a program that identifies the nation’s leading scientists, emerging and future scientists, and science teachers.

The New Zealand Science Curriculum allows for flexibility depending on contextual factors such as school location, interests of students, and teachers’ specialization. The curriculum has the “Nature of Science” as its foundation, which supports students learning the skills essential to a scientist, such as problem-solving and effective communication. The Nature of Science refers to the skills required to work as a scientist, how to communicate science effectively through science-specific vocabulary, and how to participate in debates and issues with a scientific perspective.

School administrators support innovation and risk-taking by teachers, which fosters the “let’s have a go” attitude. In my own classroom, I utilize computer technology to create virtual science lessons that support and encourage students to think for themselves and learn at their own pace. Virtual Lessons are Web-based documents that support learning in and outside the classroom. They include support for students of all abilities by providing digital resources targeted at different levels of thinking. These could include digital flashcards that support vocabulary development, videos that explain the relationships between ideas or facts, and links to websites that allow students to create cartoon animations. The students are then supported by the use of instant messaging, online collaborative documents, and email so they can get support from their peers and myself at anytime. I provide students with various levels of success criteria, which are statements that students and teachers use to evaluate performance. In every lesson I provide the students with three different levels of success criteria, each providing an increase in cognitive demand. The following is an example based on the topic of the carbon cycle:
I can identify the different parts of the carbon cycle.

I can explain how all the parts interact with each other to form the carbon cycle.
I can predict the effect that removing one part of the carbon cycle has on the environment.
These provide challenge for all abilities and at the same time make it clear what students need to do to be successful. I value creativity and innovation, and this greatly influences the opportunities I provide for students.

My students learn to love to be challenged and to see that all ideas help develop greater understanding. Students value the opportunity to contribute to others’ understanding, and they disengage when a teacher is simply repeating facts or ideas.

[div class=attrib]Read the entire article after the jump.[end-div]

[div class=attrib]Image: Coloma 1914 Classroom. Courtesy of Coloma Convent School, Croydon UK.[end-div]

King Canute or Mother Nature in North Carolina, Virginia, Texas?

Legislators in North Carolina recently went one better than King C’Nut (Canute). The king of Denmark, England, Norway and parts of Sweden during various periods between 1018 and 1035, famously and unsuccessfully tried to hold back the incoming tide. The now mythic story tells of Canute’s arrogance. Not to be outdone, North Carolina’s state legislature recently passed a law that bans state agencies from reporting that sea-level rise is accelerating.

The bill From North Carolina states:

“… rates shall only be determined using historical data, and these data shall be limited to the time period following the year 1900. Rates of sea-level rise may be extrapolated linearly to estimate future rates of rise but shall not include scenarios of accelerated rates of sea-level rise.”

This comes hot on the heals of the recent revisionist push in Virginia where references to phrases such as “sea level rise” and “climate change” are forbidden in official state communications. Last year of course, Texas led the way for other states following the climate science denial program when the Texas Commission on Environmental Quality, which had commissioned a scientific study of Galveston Bay, removed all references to “rising sea levels”.

For more detailed reporting on this unsurprising and laughable state of affairs check out this article at Skeptical Science.

[div class=attrib]From Scientific American:[end-div]

Less than two weeks after the state’s senate passed a climate science-squelching bill, research shows that sea level along the coast between N.C. and Massachusetts is rising faster than anywhere on Earth.

Could nature be mocking North Carolina’s law-makers? Less than two weeks after the state’s senate passed a bill banning state agencies from reporting that sea-level rise is accelerating, research has shown that the coast between North Carolina and Massachusetts is experiencing the fastest sea-level rise in the world.

Asbury Sallenger, an oceanographer at the US Geological Survey in St Petersburg, Florida, and his colleagues analysed tide-gauge records from around North America. On 24 June, they reported in Nature Climate Change that since 1980, sea-level rise between Cape Hatteras, North Carolina, and Boston, Massachusetts, has accelerated to between 2 and 3.7 millimetres per year. That is three to four times the global average, and it means the coast could see 20–29 centimetres of sea-level rise on top of the metre predicted for the world as a whole by 2100 ( A. H. Sallenger Jr et al. Nature Clim. Change http://doi.org/hz4; 2012).

“Many people mistakenly think that the rate of sea-level rise is the same everywhere as glaciers and ice caps melt,” says Marcia McNutt, director of the US Geological Survey. But variations in currents and land movements can cause large regional differences. The hotspot is consistent with the slowing measured in Atlantic Ocean circulation, which may be tied to changes in water temperature, salinity and density.

North Carolina’s senators, however, have tried to stop state-funded researchers from releasing similar reports. The law approved by the senate on 12 June banned scientists in state agencies from using exponential extrapolation to predict sea-level rise, requiring instead that they stick to linear projections based on historical data.

Following international opprobrium, the state’s House of Representatives rejected the bill on 19 June. However, a compromise between the house and the senate forbids state agencies from basing any laws or plans on exponential extrapolations for the next three to four years, while the state conducts a new sea-level study.

According to local media, the bill was the handiwork of industry lobbyists and coastal municipalities who feared that investors and property developers would be scared off by predictions of high sea-level rises. The lobbyists invoked a paper published in the Journal of Coastal Research last year by James Houston, retired director of the US Army Corps of Engineers’ research centre in Vicksburg, Mississippi, and Robert Dean, emeritus professor of coastal engineering at the University of Florida in Gainesville. They reported that global sea-level rise has slowed since 1930 ( J. R. Houston and R. G. Dean J. Coastal Res. 27 , 409 – 417 ; 2011) — a contention that climate sceptics around the world have seized on.

Speaking to Nature, Dean accused the oceanographic community of ideological bias. “In the United States, there is an overemphasis on unrealistically high sea-level rise,” he says. “The reason is budgets. I am retired, so I have the freedom to report what I find without any bias or need to chase funding.” But Sallenger says that Houston and Dean’s choice of data sets masks acceleration in the sea-level-rise hotspot.

[div class=attrib]Read the entire article after the jump.[end-div]

[div class=attrib]Image courtesy of Policymic.[end-div]

Good Grades and Good Drugs?

A sad story chronicling the rise in amphetamine use in the quest for good school grades. More frightening now is the increase in addiction of ever younger kids, and not for dubious goal of excelling at school. Many kids are just taking the drug to get high.

[div class=attrib]From the Telegraph:[end-div]

The New York Times has finally woken up to America’s biggest unacknowledged drug problem: the massive overprescription of the amphetamine drug Adderall for Attention Deficit Hyperactivity Disorder. Kids have been selling each other this powerful – and extremely moreish – mood enhancer for years, as ADHD diagnoses and prescriptions for the drug have shot up.

Now, children are snorting the stuff, breaking open the capsules and ingesting it using the time-honoured tool of a rolled-up bank note.

The NYT seems to think these teenage drug users are interested in boosting their grades. It claims that, for children without ADHD, “just one pill can jolt them with the energy focus to push through all-night homework binges and stay awake during exams afterward”.

Really? There are two problems with this.

First, the idea that ADHD kids are “normal” on Adderall and its methylphenidate alternative Ritalin – gentler in its effect but still a psychostimulant – is open to question. Reading this scorching article by the child psychologist Prof L Alan Sroufe, who says there’s no evidence that attention-deficit children are born with an organic disease, or that ADHD and non-ADHD kids react differently to their doctor-prescribed amphetamines. Yes, there’s an initial boost to concentration, but the effect wears off – and addiction often takes its place.

Second, the school pupils illicitly borrowing or buying Adderall aren’t necessarily doing it to concentrate on their work. They’re doing it to get high.

Adderall, with its mixture of amphetamine salts, has the ability to make you as euphoric as a line of cocaine – and keep you that way, particularly if it’s the slow-release version and you’re taking it for the first time. At least, that was my experience. Here’s what happened.

I was staying with a hospital consultant and his attorney wife in the East Bay just outside San Francisco. I’d driven overnight from Los Angeles after a flight from London; I was jetlagged, sleep-deprived and facing a deadline to write an article for the Spectator about, of all things, Bach cantatas.

Sitting in the courtyard garden with my laptop, I tapped and deleted one clumsy sentence after another. The sun was going down; my hostess saw me shivering and popped out with a blanket, a cup of herbal tea and ‘something to help you concentrate’.

I took the pill, didn’t notice any effect, and was glad when I was called in for dinner.

The dining room was a Californian take on the Second Empire. The lady next to me was a Southern Belle turned realtor, her eyelids already drooping from the effects of her third giant glass of Napa Valley chardonnay. She began to tell me about her divorce. Every time she refilled her glass, her new husband raised his eyes to heaven.

It felt as if I was stuck in an episode of Dallas, or a very bad Tennessee Williams play. But it didn’t matter in the least because, at some stage between the mozzarella salad and the grilled chicken, I’d become as high as a kite.

Adderall helps you concentrate, no doubt about it. I was riveted by the details of this woman’s alimony settlement. Even she, utterly self- obsessed as she was, was surprised by my gushing empathy. After dinner, I sat down at the kitchen table to finish the article. The head rush was beginning to wear off, but then, just as I started typing, a second wave of amphetamine pushed its way into my bloodstream. This was timed-release Adderall. Gratefully I plunged into 18th-century Leipzig, meticulously noting the catalogue numbers of cantatas. It was as if the great Johann Sebastian himself was looking over my shoulder. By the time I glanced at the clock, it was five in the morning. My pleasure at finishing the article was boosted by the dopamine high. What a lovely drug.

The blues didn’t hit me until the next day – and took the best part of a week to banish.

And this is what they give to nine-year-olds.

[div class=attrib]Read the entire article after the jump.[end-div]

[div class=attrib]From the New York Times:[end-div]

He steered into the high school parking lot, clicked off the ignition and scanned the scraps of his recent weeks. Crinkled chip bags on the dashboard. Soda cups at his feet. And on the passenger seat, a rumpled SAT practice book whose owner had been told since fourth grade he was headed to the Ivy League. Pencils up in 20 minutes.

The boy exhaled. Before opening the car door, he recalled recently, he twisted open a capsule of orange powder and arranged it in a neat line on the armrest. He leaned over, closed one nostril and snorted it.

Throughout the parking lot, he said, eight of his friends did the same thing.

The drug was not cocaine or heroin, but Adderall, an amphetamine prescribed for attention deficit hyperactivity disorder that the boy said he and his friends routinely shared to study late into the night, focus during tests and ultimately get the grades worthy of their prestigious high school in an affluent suburb of New York City. The drug did more than just jolt them awake for the 8 a.m. SAT; it gave them a tunnel focus tailor-made for the marathon of tests long known to make or break college applications.

“Everyone in school either has a prescription or has a friend who does,” the boy said.

At high schools across the United States, pressure over grades and competition for college admissions are encouraging students to abuse prescription stimulants, according to interviews with students, parents and doctors. Pills that have been a staple in some college and graduate school circles are going from rare to routine in many academically competitive high schools, where teenagers say they get them from friends, buy them from student dealers or fake symptoms to their parents and doctors to get prescriptions.

Of the more than 200 students, school officials, parents and others contacted for this article, about 40 agreed to share their experiences. Most students spoke on the condition that they be identified by only a first or middle name, or not at all, out of concern for their college prospects or their school systems’ reputations — and their own.

“It’s throughout all the private schools here,” said DeAnsin Parker, a New York psychologist who treats many adolescents from affluent neighborhoods like the Upper East Side. “It’s not as if there is one school where this is the culture. This is the culture.”

Observed Gary Boggs, a special agent for the Drug Enforcement Administration, “We’re seeing it all across the United States.”

The D.E.A. lists prescription stimulants like Adderall and Vyvanse (amphetamines) and Ritalin and Focalin (methylphenidates) as Class 2 controlled substances — the same as cocaine and morphine — because they rank among the most addictive substances that have a medical use. (By comparison, the long-abused anti-anxiety drug Valium is in the lower Class 4.) So they carry high legal risks, too, as few teenagers appreciate that merely giving a friend an Adderall or Vyvanse pill is the same as selling it and can be prosecuted as a felony.

While these medicines tend to calm people with A.D.H.D., those without the disorder find that just one pill can jolt them with the energy and focus to push through all-night homework binges and stay awake during exams afterward. “It’s like it does your work for you,” said William, a recent graduate of the Birch Wathen Lenox School on the Upper East Side of Manhattan.

But abuse of prescription stimulants can lead to depression and mood swings (from sleep deprivation), heart irregularities and acute exhaustion or psychosis during withdrawal, doctors say. Little is known about the long-term effects of abuse of stimulants among the young. Drug counselors say that for some teenagers, the pills eventually become an entry to the abuse of painkillers and sleep aids.

“Once you break the seal on using pills, or any of that stuff, it’s not scary anymore — especially when you’re getting A’s,” said the boy who snorted Adderall in the parking lot. He spoke from the couch of his drug counselor, detailing how he later became addicted to the painkiller Percocet and eventually heroin.

Paul L. Hokemeyer, a family therapist at Caron Treatment Centers in Manhattan, said: “Children have prefrontal cortexes that are not fully developed, and we’re changing the chemistry of the brain. That’s what these drugs do. It’s one thing if you have a real deficiency — the medicine is really important to those people — but not if your deficiency is not getting into Brown.”

The number of prescriptions for A.D.H.D. medications dispensed for young people ages 10 to 19 has risen 26 percent since 2007, to almost 21 million yearly, according to IMS Health, a health care information company — a number that experts estimate corresponds to more than two million individuals. But there is no reliable research on how many high school students take stimulants as a study aid. Doctors and teenagers from more than 15 schools across the nation with high academic standards estimated that the portion of students who do so ranges from 15 percent to 40 percent.

“They’re the A students, sometimes the B students, who are trying to get good grades,” said one senior at Lower Merion High School in Ardmore, a Philadelphia suburb, who said he makes hundreds of dollars a week selling prescription drugs, usually priced at $5 to $20 per pill, to classmates as young as freshmen. “They’re the quote-unquote good kids, basically.”

The trend was driven home last month to Nan Radulovic, a psychotherapist in Santa Monica, Calif. Within a few days, she said, an 11th grader, a ninth grader and an eighth grader asked for prescriptions for Adderall solely for better grades. From one girl, she recalled, it was not quite a request.

“If you don’t give me the prescription,” Dr. Radulovic said the girl told her, “I’ll just get it from kids at school.”

[div class=attrib]Read the entire article here.[end-div]

[div class=attrib]Image: Illegal use of Adderall is prevalent enough that many students seem to take it for granted. Courtesy of Minnesota Post / Flickr/ CC/ Hipsxxhearts.[end-div]

The 10,000 Year Clock

Aside from the ubiquitous plastic grocery bag will any human made artifact last 10,000 years? Before you answer, let’s qualify the question by mandating the artifact have some long-term value. That would seem to eliminate plastic bags, plastic toys embedded in fast food meals, and DVDs of reality “stars” ripped from YouTube. What does that leave? Most human made products consisting of metals or biodegradable components, such as paper and wood, will rust, rot or breakdown in 20-300 years. Even some plastics left exposed to sun and air will breakdown within a thousand years. Of course, buried deep in a landfill, plastic containers, styrofoam cups and throwaway diapers may remain with us for tens or hundreds of thousands of years.

Archaeological excavations show us that artifacts made of glass and ceramic would fit the bill — lasting well into the year 12012 and beyond. But, in the majority of cases we usually unearth fragments of things.

But what if some ingenious humans could build something that would still be around 10,000 years from now? Better still, build something that will still function as designed 10,000 years from now. This would represent an extraordinary feat of contemporary design and engineering. And, more importantly it would provide a powerful story for countless generations beginning with ours.

So, enter Danny Hillis and the Clock of the Long Now (also knows as the Millennium Clock or the 10,000 Year Clock). Danny Hillis is an inventor, scientist, and computer designer. He pioneered the concept of massively parallel computers.

In Hillis’ own words:

Ten thousand years – the life span I hope for the clock – is about as long as the history of human technology. We have fragments of pots that old. Geologically, it’s a blink of an eye. When you start thinking about building something that lasts that long, the real problem is not decay and corrosion, or even the power source. The real problem is people. If something becomes unimportant to people, it gets scrapped for parts; if it becomes important, it turns into a symbol and must eventually be destroyed. The only way to survive over the long run is to be made of materials large and worthless, like Stonehenge and the Pyramids, or to become lost. The Dead Sea Scrolls managed to survive by remaining lost for a couple millennia. Now that they’ve been located and preserved in a museum, they’re probably doomed. I give them two centuries – tops. The fate of really old things leads me to think that the clock should be copied and hidden.

Plans call for the 200 foot tall, 10,000 Year Clock to be installed inside a mountain in remote west Texas, with a second location in remote eastern Nevada. Design and engineering work on the clock, and preparation of the Clock’s Texas home are underway.

For more on the 10,000 Year Clock jump to the Long Now Foundation, here.

[div class=attrib]More from Rationally Speaking:[end-div]

I recently read Brian Hayes’ wonderful collection of mathematically oriented essays called Group Theory In The Bedroom, and Other Mathematical Diversions. Not surprisingly, the book contained plenty of philosophical musings too. In one of the essays, called “Clock of Ages,” Hayes describes the intricacies of clock building and he provides some interesting historical fodder.

For instance, we learn that in the sixteenth century Conrad Dasypodius, a Swiss mathematician, could have chosen to restore the old Clock of the Three Kings in Strasbourg Cathedral. Dasypodius, however, preferred to build a new clock of his own rather than maintain an old one. Over two centuries later, Jean-Baptiste Schwilgue was asked to repair the clock built by Dasypodius, but he decided to build a new and better clock which would last for 10,000 years.

Did you know that a large-scale project is underway to build another clock that will be able to run with minimal maintenance and interruption for ten millennia? It’s called The 10,000 Year Clock and its construction is sponsored by The Long Now Foundation. The 10,000 Year Clock is, however, being built for more than just its precision and durability. If the creators’ intentions are realized, then the clock will serve as a symbol to encourage long-term thinking about the needs and claims of future generations. Of course, if all goes to plan, our future descendants will be left to maintain it too. The interesting question is: will they want to?

If history is any indicator, then I think you know the answer. As Hayes puts it: “The fact is, winding and dusting and fixing somebody else’s old clock is boring. Building a brand-new clock of your own is much more fun, especially if you can pretend that it’s going to inspire awe and wonder for the ages to come. So why not have the fun now and let the future generations do the boring bit.” I think Hayes is right, it seems humans are, by nature, builders and not maintainers.

Projects like The 10,000 Year Clock are often undertaken with the noblest of environmental intentions, but the old proverb is relevant here: the road to hell is paved with good intentions. What I find troubling, then, is that much of the environmental do-goodery in the world may actually be making things worse. It’s often nothing more than a form of conspicuous consumption, which is a term coined by the economist and sociologist Thorstein Veblen. When it pertains specifically to “green” purchases, I like to call it being conspicuously environmental. Let’s use cars as an example. Obviously it depends on how the calculations are processed, but in many instances keeping and maintaining an old clunker is more environmentally friendly than is buying a new hybrid. I can’t help but think that the same must be true of building new clocks.

In his book, The Conundrum, David Owen writes: “How appealing would ‘green’ seem if it meant less innovation and fewer cool gadgets — not more?” Not very, although I suppose that was meant to be a rhetorical question. I enjoy cool gadgets as much as the next person, but it’s delusional to believe that conspicuous consumption is somehow a gift to the environment.

Using insights from evolutionary psychology and signaling theory, I think there is also another issue at play here. Buying conspicuously environmental goods, like a Prius, sends a signal to others that one cares about the environment. But if it’s truly the environment (and not signaling) that one is worried about, then surely less consumption must be better than more. The homeless person ironically has a lesser environmental impact than your average yuppie, yet he is rarely recognized as an environmental hero. Using this logic I can’t help but conclude that killing yourself might just be the most environmentally friendly act of all time (if it wasn’t blatantly obvious, this is a joke). The lesson here is that we shouldn’t confuse smug signaling with actually helping.

[div class=attrib]Read the entire article after the jump.[end-div]

[div class=attrib]Image: Prototype of the 10,000 Year Clock. Courtesy of the Long Now Foundation / Science Museum of London.[end-div]

High Fructose Corn Syrup = Corn Sugar?

Hats off to the global agro-industrial complex that feeds most of the Earth’s inhabitants. With high fructose corn syrup (HFCS) getting an increasingly bad rap for helping to expand our waistlines and catalyze our diabetes, the industry is becoming more creative.

However, it’s only the type of “creativity” that a cynic would come to expect from a faceless, trillion dollar industry; it’s not a fresh, natural innovation. The industry wants to rename HFCS to “corn sugar”, making it sound healthier and more natural in the process.

[div class=attrib]From the New York Times:[end-div]

The United States Food and Drug Administration has rejected a request from the Corn Refiners Association to change the name of high-fructose corn syrup.

The association, which represents the companies that make the syrup, had petitioned the F.D.A. in September 2010 to begin calling the much-maligned sweetener “corn sugar.” The request came on the heels of a national advertising campaign promoting the syrup as a natural ingredient made from corn.

But in a letter, Michael M. Landa, director of the Center for Food Safety and Applied Nutrition at the F.D.A., denied the petition, saying that the term “sugar” is used only for food “that is solid, dried and crystallized.”

“HFCS is an aqueous solution sweetener derived from corn after enzymatic hydrolysis of cornstarch, followed by enzymatic conversion of glucose (dextrose) to fructose,” the letter stated. “Thus, the use of the term ‘sugar’ to describe HFCS, a product that is a syrup, would not accurately identify or describe the basic nature of the food or its characterizing properties.”

In addition, the F.D.A. concluded that the term “corn sugar” has been used to describe the sweetener dextrose and therefore should not be used to describe high-fructose corn syrup. The agency also said the term “corn sugar” could pose a risk to consumers who have been advised to avoid fructose because of a hereditary fructose intolerance or fructose malabsorption.

[div class=attrib]Read the entire article after the jump.[end-div]

[div class=attrib]Image: Fructose vs. D-Glucose Structural Formulae. Courtesy of Wikipedia.[end-div]

The Most Beautiful Railway Stations

[div class=attrib]From Flavorwire:[end-div]

In 1972, Pulitzer Prize-winning author, and The New York Times’ very first architecture critic, Ada Louise Huxtable observed that “nothing was more up-to-date when it was built, or is more obsolete today, than the railroad station.” A comment on the emerging age of the jetliner and a swanky commercial air travel industry that made the behemoth train stations of the time appear as cumbersome relics of an outdated industrial era, we don’t think the judgment holds up today — at all. Like so many things that we wrote off in favor of what was seemingly more modern and efficient (ahem, vinyl records and Polaroid film), the train station is back and better than ever. So, we’re taking the time to look back at some of the greatest stations still standing.

[div class=attrib]See other beautiful stations and read the entire article after the jump.[end-div]

[div class=attrib]Image: Grand Central Terminal — New York City, New York. Courtesy of Flavorwire.[end-div]

Java by the Numbers

If you think the United States is a nation of coffee drinkers, thing again. The U.S., only ranks eighth in terms of annual java consumption per person. Way out in front is Finland. Makes one wonder if there is a correlation of coffee drinking and heavy metal music.

[div class=attrib]Infographic courtesy of Hamilton Beach.[end-div]

Human Evolution: Stalled

It takes no expert neuroscientist, anthropologist or evolutionary biologist to recognize that human evolution has probably stalled. After all, one only needs to observe our obsession with reality TV. Yes, evolution screeched to a halt around 1999, when reality TV hit critical mass in the mainstream public consciousness. So, what of evolution?

[div class=attrib]From the Wall Street Journal:[end-div]

If you write about genetics and evolution, one of the commonest questions you are likely to be asked at public events is whether human evolution has stopped. It is a surprisingly hard question to answer.

I’m tempted to give a flippant response, borrowed from the biologist Richard Dawkins: Since any human trait that increases the number of babies is likely to gain ground through natural selection, we can say with some confidence that incompetence in the use of contraceptives is probably on the rise (though only if those unintended babies themselves thrive enough to breed in turn).

More seriously, infertility treatment is almost certainly leading to an increase in some kinds of infertility. For example, a procedure called “intra-cytoplasmic sperm injection” allows men with immobile sperm to father children. This is an example of the “relaxation” of selection pressures caused by modern medicine. You can now inherit traits that previously prevented human beings from surviving to adulthood, procreating when they got there or caring for children thereafter. So the genetic diversity of the human genome is undoubtedly increasing.

Or it was until recently. Now, thanks to pre-implantation genetic diagnosis, parents can deliberately choose to implant embryos that lack certain deleterious mutations carried in their families, with the result that genes for Tay-Sachs, Huntington’s and other diseases are retreating in frequency. The old and overblown worry of the early eugenicists—that “bad” mutations were progressively accumulating in the species—is beginning to be addressed not by stopping people from breeding, but by allowing them to breed, safe in the knowledge that they won’t pass on painful conditions.

Still, recent analyses of the human genome reveal a huge number of rare—and thus probably fairly new—mutations. One study, by John Novembre of the University of California, Los Angeles, and his colleagues, looked at 202 genes in 14,002 people and found one genetic variant in somebody every 17 letters of DNA code, much more than expected. “Our results suggest there are many, many places in the genome where one individual, or a few individuals, have something different,” said Dr. Novembre.

Another team, led by Joshua Akey of the University of Washington, studied 1,351 people of European and 1,088 of African ancestry, sequencing 15,585 genes and locating more than a half million single-letter DNA variations. People of African descent had twice as many new mutations as people of European descent, or 762 versus 382. Dr. Akey blames the population explosion of the past 5,000 years for this increase. Not only does a larger population allow more variants; it also implies less severe selection against mildly disadvantageous genes.

So we’re evolving as a species toward greater individual (rather than racial) genetic diversity. But this isn’t what most people mean when they ask if evolution has stopped. Mainly they seem to mean: “Has brain size stopped increasing?” For a process that takes millions of years, any answer about a particular instant in time is close to meaningless. Nonetheless, the short answer is probably “yes.”

[div class=attrib]Read the entire article after the jump.[end-div]

[div class=attrib]Image: The “Robot Evolution”. Courtesy of STRK3.[end-div]

Reconnecting with Our Urban Selves

Christopher Mims over at the Technology Review revisits a recent study of our social networks, both real-world and online. It’s startling to see the growth in our social isolation despite the corresponding growth in technologies that increase our ability to communicate and interact with one another. Is the suburbanization of our species to blame, and can Facebook save us?
[div class=attrib]From Technology Review:[end-div]

In 2009, the Pew Internet Trust published a survey worth resurfacing for what it says about the significance of Facebook. The study was inspired by earlier research that “argued that since 1985 Americans have become more socially isolated, the size of their discussion networks has declined, and the diversity of those people with whom they discuss important matters has decreased.”

In particular, the study found that Americans have fewer close ties to those from their neighborhoods and from voluntary associations. Sociologists Miller McPherson, Lynn Smith-Lovin and Matthew Brashears suggest that new technologies, such as the internet and mobile phone, may play a role in advancing this trend.

If you read through all the results from Pew’s survey, you’ll discover two surprising things:

1. “Use of newer information and communication technologies (ICTs), such as the internet and mobile phones, is not the social change responsible for the restructuring of Americans’ core networks. We found that ownership of a mobile phone and participation in a variety of internet activities were associated with larger and more diverse core discussion networks.”

2. However, Americans on the whole are more isolated than they were in 1985. “The average size of Americans’ core discussion networks has declined since 1985; the mean network size has dropped by about one-third or a loss of approximately one confidant.” In addition, “The diversity of core discussion networks has markedly declined; discussion networks are less likely to contain non-kin – that is, people who are not relatives by blood or marriage.”

In other words, the technologies that have isolated Americans are anything but informational. It’s not hard to imagine what they are, as there’s been plenty of research on the subject. These technologies are the automobile, sprawl and suburbia. We know that neighborhoods that aren’t walkable decrease the number of our social connections and increase obesity. We know that commutes make us miserable, and that time spent in an automobile affects everything from our home life to our level of anxiety and depression.

Indirect evidence for this can be found in the demonstrated preferences of Millenials, who are opting for cell phones over automobiles and who would rather live in the urban cores their parents abandoned, ride mass transit and in all other respects physically re-integrate themselves with the sort of village life that is possible only in the most walkable portions of cities.

Meanwhile, it’s worth contemplating one of the primary factors that drove Facebook’s adoption by (soon) 1 billion people: Loneliness. Americans have less support than ever — one in eight in the Pew survey reported having no “discussion confidants.”

It’s clear that for all our fears about the ability of our mobile devices to isolate us in public, the primary way they’re actually used is for connection.

[div class=attrib]Read the entire article after the jump.[end-div]

[div class=attrib]Image: Typical suburban landscape. Courtesy of Treehugger.[end-div]

Heavy Metal Density

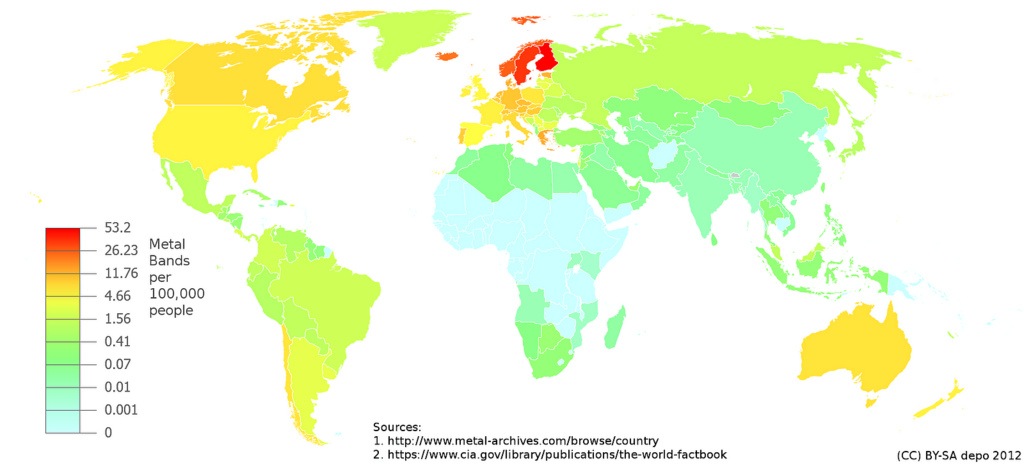
Heavy Metal in the musical sense, not as in elements, such as iron or manganese, is really popular in Finland and Iceland. It even pops up in Iran and Saudia Arabia.

[div class=attrib]Frank Jacobs over at Strange Maps tells us more.[end-div]

This map reflects the number of heavy metal bands per 100,000 inhabitants for each country in the world. It codes the result on a colour temperature scale, with blue indicating low occurrence, and red high occurrence. The data for this map is taken from the extensive Encyclopaedia Metallum, an online archive of metal music that lists bands per country, and provides some background by listing their subgenre (Progressive Death Metal, Symphonic Gothic Metal, Groove Metal, etc).

Even if you barely know your Def Leppard from your Deep Purple, you won’t be surprised by the obvious point of this map: Scandinavia is the world capital of heavy metal music. Leaders of the pack are Finland and Sweden, coloured with the hottest shade of red. With 2,825 metal bands listed in the Encyclopaedia Metallum, the figure for Finland works out to 54.3 bands per 100,000 Finns (for a total of 5.2 million inhabitants). Second is Sweden, with a whopping 3,398 band entries. For 9.1 million Swedes, that amounts to 37.3 metal bands per 100,000 inhabitants.

The next-hottest shade of red is coloured in by Norway and Iceland. The Icelandic situation is interesting: with only 71 bands listed, the country seems not particulary metal-oriented. But the total population of the North Atlantic island is a mere 313,000. Which produces a result of 22.6 metal bands per 100,000 inhabitants. That’s almost the double, relatively speaking, of Denmark, which has a score of 12.9 (708 metal bands for 5.5 million Danes)

The following shades of colour, from dark orange to light yellow, are almost all found in North America, Europe and Australasia. A notable addition to this list of usual suspects are Israel, and the three countries of Latin America’s Southern Cone: Chile, Argentina and Uruguay.

Some interesting variations in Europe: Portugal is much darker – i.e. much more metal-oriented – than its Iberian neighbour Spain, and Greece is a solid southern outpost of metal on an otherwise wishy-washy Balkan Peninsula.

On the other side of the scale, light blue indicates the worst – or at least loneliest – places to be a metal fan: Papua New Guinea, North Korea, Cambodia, Afghanistan, Yemen, and most of Africa outside its northern and southern fringe. According to the Encyclopaedia Metallum, there isn’t a single metal band in any of those countries.

[div class=attrib]Read the entire article after the jump.[end-div]

Our Children: Independently Dependent

Why can’t our kids tie their own shoes?
Are we raising our children to be self-obsessed, attention-seeking, helpless and dependent groupthinkers? And, why may the phenomenon of “family time” in the U.S. be a key culprit?

These are some of the questions raised by anthropologist Elinor Ochs and her colleagues. Over the last decade they have studied family life across the globe, from the Amazon region, to Samoa, and middle-America.

[div class=attrib]From the Wall Street Journal:[end-div]

Why do American children depend on their parents to do things for them that they are capable of doing for themselves? How do U.S. working parents’ views of “family time” affect their stress levels? These are just two of the questions that researchers at UCLA’s Center on Everyday Lives of Families, or CELF, are trying to answer in their work.

By studying families at home—or, as the scientists say, “in vivo”—rather than in a lab, they hope to better grasp how families with two working parents balance child care, household duties and career, and how this balance affects their health and well-being.

The center, which also includes sociologists, psychologists and archeologists, wants to understand “what the middle class thought, felt and what they did,” says Dr. Ochs. The researchers plan to publish two books this year on their work, and say they hope the findings may help families become closer and healthier.

Ten years ago, the UCLA team recorded video for a week of nearly every moment at home in the lives of 32 Southern California families. They have been picking apart the footage ever since, scrutinizing behavior, comments and even their refrigerators’s contents for clues.

The families, recruited primarily through ads, owned their own homes and had two or three children, at least one of whom was between 7 and 12 years old. About a third of the families had at least one nonwhite member, and two were headed by same-sex couples. Each family was filmed by two cameras and watched all day by at least three observers.

Among the findings: The families had very a child-centered focus, which may help explain the “dependency dilemma” seen among American middle-class families, says Dr. Ochs. Parents intend to develop their children’s independence, yet raise them to be relatively dependent, even when the kids have the skills to act on their own, she says.

In addition, these parents tended to have a very specific, idealized way of thinking about family time, says Tami Kremer-Sadlik, a former CELF research director who is now the director of programs for the division of social sciences at UCLA. These ideals appeared to generate guilt when work intruded on family life, and left parents feeling pressured to create perfect time together. The researchers noted that the presence of the observers may have altered some of the families’ behavior.

How kids develop moral responsibility is an area of focus for the researchers. Dr. Ochs, who began her career in far-off regions of the world studying the concept of “baby talk,” noticed that American children seemed relatively helpless compared with those in other cultures she and colleagues had observed.

In those cultures, young children were expected to contribute substantially to the community, says Dr. Ochs. Children in Samoa serve food to their elders, waiting patiently in front of them before they eat, as shown in one video snippet. Another video clip shows a girl around 5 years of age in Peru’s Amazon region climbing a tall tree to harvest papaya, and helping haul logs thicker than her leg to stoke a fire.

By contrast, the U.S. videos showed Los Angeles parents focusing more on the children, using simplified talk with them, doing most of the housework and intervening quickly when the kids had trouble completing a task.

In 22 of 30 families, children frequently ignored or resisted appeals to help, according to a study published in the journal Ethos in 2009. In the remaining eight families, the children weren’t asked to do much. In some cases, the children routinely asked the parents to do tasks, like getting them silverware. “How am I supposed to cut my food?” Dr. Ochs recalls one girl asking her parents.

Asking children to do a task led to much negotiation, and when parents asked, it sounded often like they were asking a favor, not making a demand, researchers said. Parents interviewed about their behavior said it was often too much trouble to ask.

For instance, one exchange caught on video shows an 8-year-old named Ben sprawled out on a couch near the front door, lifting his white, high-top sneaker to his father, the shoe laced. “Dad, untie my shoe,” he pleads. His father says Ben needs to say “please.”

“Please untie my shoe,” says the child in an identical tone as before. After his father hands the shoe back to him, Ben says, “Please put my shoe on and tie it,” and his father obliges.

[div class=attrib]Read the entire article after the jump:[end-div]

[div class=attrib]Image courtesy of Kyle T. Webster / Wall Street Journal.[end-div]

Skyscrapers A La Mode

Since 2006 Evolo architecture magazine has run a competition for architects to bring life to their most fantastic skyscraper designs. All the finalists of 2012 competition presented some stunning ideas, and topped by the winner, Himalaya Water Tower, from Zhi Zheng, Hongchuan Zhao, Dongbai Song of China.

[div class=attrib]From Evolo:[end-div]

Housed within 55,000 glaciers in the Himalaya Mountains sits 40 percent of the world’s fresh water. The massive ice sheets are melting at a faster-than-ever pace due to climate change, posing possible dire consequences for the continent of Asia and the entire world stand, and especially for the villages and cities that sit on the seven rivers that come are fed from the Himalayas’ runoff as they respond with erratic flooding or drought.

The “Himalaya Water Tower” is a skyscraper located high in the mountain range that serves to store water and helps regulate its dispersal to the land below as the mountains’ natural supplies dry up. The skyscraper, which can be replicated en masse, will collect water in the rainy season, purify it, freeze it into ice and store it for future use. The water distribution schedule will evolve with the needs of residents below; while it can be used to help in times of current drought, it’s also meant to store plentiful water for future generations.

Follow the other notable finalists at Evolo magazine after the jump.

Engineering the Ultimate Solar Power Collector: The Leaf

[div class=attrib]From Cosmic Log:[end-div]

Researchers have been trying for decades to improve upon Mother Nature’s favorite solar-power trick — photosynthesis — but now they finally think they see the sunlight at the end of the tunnel.

“We now understand photosynthesis much better than we did 20 years ago,” said Richard Cogdell, a botanist at the University of Glasgow who has been doing research on bacterial photosynthesis for more than 30 years. He and three colleagues discussed their efforts to tweak the process that powers the world’s plant life today in Vancouver, Canada, during the annual meeting of the American Association for the Advancement of Science.

The researchers are taking different approaches to the challenge, but what they have in common is their search for ways to get something extra out of the biochemical process that uses sunlight to turn carbon dioxide and water into sugar and oxygen. “You can really view photosynthesis as an assembly line with about 168 steps,” said Steve Long, head of the University of Illinois’ Photosynthesis and Atmospheric Change Laboratory.

Revving up Rubisco
Howard Griffiths, a plant physiologist at the University of Cambridge, just wants to make improvements in one section of that assembly line. His research focuses on ways to get more power out of the part of the process driven by an enzyme called Rubisco. He said he’s trying to do what many auto mechanics have done to make their engines run more efficiently: “You turbocharge it.”

Some plants, such as sugar cane and corn, already have a turbocharged Rubisco engine, thanks to a molecular pathway known as C4. Geneticists believe the C4 pathway started playing a significant role in plant physiology in just the past 10 million years or so. Now Griffiths is looking into strategies to add the C4 turbocharger to rice, which ranks among the world’s most widely planted staple crops.

The new cellular machinery might be packaged in a micro-compartment that operates within the plant cell. That’s the way biochemical turbochargers work in algae and cyanobacteria. Griffiths and his colleagues are looking at ways to create similar micro-compartments for higher plants. The payoff would come in the form of more efficient carbon dioxide conversion, with higher crop productivity as a result. “For a given amount of carbon gain, the plant uses less water,” Griffiths said.

[div class=attrib]Read the entire article here.[end-div]

[div class=attrib]Image courtesy of Kumaravel via Flickr, Creative Commons.[end-div]

Great Architecture

Jonathan Glancey, architecture critic at the Guardian in the UK for the last fifteen years, is moving on to greener pastures, and presumably new buildings. In his final article for the newspaper he reflects on some buildings that have engendered shock and/or awe.

[div class=attrib]From the Guardian:[end-div]

Fifteen years is not a long time in architecture. It is the slowest as well as the most political of the arts. This much was clear when I joined the Guardian as its architecture and design correspondent, from the Independent, in 1997. I thought the Millennium Experience (the talk of the day) decidedly dimwitted and said so in no uncertain terms; it lacked a big idea and anything like the imagination of, say, the Great Exhibition of 1851, or the Festival of Britain in 1951.

For the macho New Labour government, newly in office and all football and testosterone, criticism of this cherished project was tantamount to sedition. They lashed out like angry cats; there were complaints from 10 Downing Street’s press office about negative coverage of the Dome. Hard to believe then, much harder now. That year’s London Model Engineer Exhibition was far more exciting; here was an enthusiastic celebration of the making of things, at a time when manufacturing was becoming increasingly looked down on.

New Labour, meanwhile, promised it would do things for architecture and urban design that Roman emperors and Renaissance princes could only have dreamed of. The north Greenwich peninsula was to become a new Florence, with trams and affordable housing. As would the Thames Gateway, that Siberia stretching – marshy, mysterious, semi-industrial – to Southend Pier and the sea. To a new, fast-breeding generation of quangocrats this land looked like a blank space on the London A-Z, ready to fill with “environmentally friendly” development. Precious little has happened there since, save for some below-standard housing, Boris Johnson’s proposal for an estuary airport and – a very good thing – an RSPB visitors’ centre designed by Van Heyningen and Haward near Purfleet on the Rainham marshes.

Labour’s promises turned out to be largely tosh, of course. Architecture and urban planning are usually best when neither hyped nor hurried. Grand plans grow best over time, as serendipity and common sense soften hard edges. In 2002, Tony Blair decided to invade Iraq – not a decision that, on the face of it, has a lot to do with architecture; but one of the articles I am most proud to have written for this paper was the story of a journey I made from one end of Iraq to the other, with Stuart Freedman, an unflappable press photographer. At the time, the Blair government was denying there would be a war, yet every Iraqi we spoke to knew the bombs were about to fall. It was my credentials as a critic and architectural historian that got me my Iraqi visa. Foreign correspondents, including several I met in Baghdad’s al-Rashid hotel, were understandably finding the terrain hard-going. But handwritten in my passport was an instruction saying: “Give this man every assistance.”

We travelled to Babylon to see Saddam’s reconstruction of the fabled walled city, and to Ur, Abraham’s home, and its daunting ziggurat and then – wonder of wonders – into the forbidden southern deserts to Eridu. Here I walked on the sand-covered remains of one of the world’s first cities. This, if anywhere, is where architecture was born. At Samarra, in northern Iraq, I climbed to the top of the wondrous spiral minaret of what was once the town’s Great Mosque. How the sun shone that day. When I got to the top, there was nothing to hang on to. I was confronted by the blazing blue sky and its gods, or God; the architecture itself was all but invisible. Saddam’s soldiers, charming recruits in starched and frayed uniforms drilled by a tough and paternal sergeant, led me through the country, through miles of unexploded war material piled high along sandy tracks, and across the paths of Shia militia.

Ten years on, Zaha Hadid, a Baghdad-born architect who has risen to stellar prominence since 2002, has won her first Iraqi commission, a new headquarters for the Iraqi National Bank in Baghdad. With luck, other inspired architects will get to work in Iraq, too, reconnecting the country with its former role as a crucible of great buildings and memorable cities.

Architecture is also the stuff of construction, engineering, maths and science. Of philosophy, sociology, Le Corbusier and who knows what else. It is also, I can’t help feeling, harder to create great buildings now than it was in the past. When Eridu or the palaces and piazzas of Renaissance Italy were shaped, architecture was the most expensive and prestigious of all cultural endeavours. Today we spread our wealth more thinly, spending ever more on disposable consumer junk, building more roads to serve ever more grim private housing estates, unsustainable supermarkets and distribution depots (and container ports and their giant ships), and the landfill sites we appear to need to shore up our insatiable, throwaway culture. Architecture has been in danger, like our indefensibly mean and horrid modern housing, of becoming little more than a commodity. Government talk of building a rash of “eco-towns” proved not just unpopular but more hot air. A policy initiative too far, the idea has effectively been dropped.

And, yet, despite all these challenges, the art form survives and even thrives. I have been moved in different ways by the magnificent Neues Museum, Berlin, a 10-year project led by David Chipperfield; by the elemental European Southern Observatory Hotel by Auer + Weber, for scientists in Chile’s Atacama Desert; and by Charles Barclay’s timber Kielder Observatory, where I spent a night in 2008 watching stars hanging above the Northumbrian forest.

I have been enchanted by the 2002 Serpentine Pavilion, a glimpse into a possible future by Toyo Ito and Cecil Balmond; by the inspiring reinvention of St Pancras station by Alastair Lansley and fellow architects; and by Blur, a truly sensational pavilion by Diller + Scofidio set on a steel jetty overlooking Lake Neuchatel at Yverdon-les-Bains. A part of Switzerland’s Expo 2002, this cat’s cradle of tensile steel was a machine for making clouds. You walked through the clouds as they appeared and, when conditions were right, watched them float away over the lake.

[div class=attrib]Read the entire article here.[end-div]

[div class=attrib]Image: The spiral minaret of the Great Mosque of Samarra, Iraq. Courtesy Reuters / Guardian.[end-div]

Suburbia as Mass Murderer

Jane Brody over at the Well blog makes a compelling case for the dismantling of suburbia. After all, these so-called “built environments” where we live, work, eat, play and raise our children, are an increasingly serious health hazard.


[div class=attrib]From the New York Times:[end-div]

Developers in the last half-century called it progress when they built homes and shopping malls far from city centers throughout the country, sounding the death knell for many downtowns. But now an alarmed cadre of public health experts say these expanded metropolitan areas have had a far more serious impact on the people who live there by creating vehicle-dependent environments that foster obesity, poor health, social isolation, excessive stress and depression.

As a result, these experts say, our “built environment” — where we live, work, play and shop — has become a leading cause of disability and death in the 21st century. Physical activity has been disappearing from the lives of young and old, and many communities are virtual “food deserts,” serviced only by convenience stores that stock nutrient-poor prepared foods and drinks.

According to Dr. Richard J. Jackson, professor and chairman of environmental health sciences at the University of California, Los Angeles, unless changes are made soon in the way many of our neighborhoods are constructed, people in the current generation (born since 1980) will be the first in America to live shorter lives than their parents do.

Although a decade ago urban planning was all but missing from public health concerns, a sea change has occurred. At a meeting of the American Public Health Association in October, Dr. Jackson said, there were about 300 presentations on how the built environment inhibits or fosters the ability to be physically active and get healthy food.

In a healthy environment, he said, “people who are young, elderly, sick or poor can meet their life needs without getting in a car,” which means creating places where it is safe and enjoyable to walk, bike, take in nature and socialize.

“People who walk more weigh less and live longer,” Dr. Jackson said. “People who are fit live longer. People who have friends and remain socially active live longer. We don’t need to prove all of this,” despite the plethora of research reports demonstrating the ill effects of current community structures.

[div class=attrib]Read the entire article here.[end-div]

[div class=attrib]Image courtesy of Duke University.[end-div]

See the Aurora, then Die

One item that features prominently on so-called “things-to-do-before-you-die” lists is seeing the Aurora Borealis, or Northern Lights.

The recent surge in sunspot activity and solar flares has caused a corresponding uptick in geo-magnetic storms here on Earth. The resulting Aurorae have been nothing short of spectacular. More images here, courtesy of Smithsonian magazine.

Driving Across the U.S. at 146,700 Miles per Hour

Through the miracle of time-lapse photography we bring you a journey of 12,225 miles across 32 States in 55 days compressed into 5 minutes. Brian Defrees snapped an image every five seconds from his car-mounted camera during the adventure, which began and ended in New York, via Washington D.C., Florida, Los Angeles and Washington State, and many points in between.

[tube]Tt-juyvIWMQ[/tube]

The Corporate One Percent of the One Percent

With the Occupy Wall Street movement and related protests continuing to gather steam much recent media and public attention has focused on 1 percent versus the remaining 99 percent of the population. By most accepted estimates, 1 percent of households control around 40 percent of the global wealth, and there is a vast discrepancy between the top and bottom of the economic spectrum. While these statistics are telling, a related analysis of corporate wealth, highlighted in the New Scientist, shows a much tighter concentration among a very select group of transnational corporations (TNC).

[div class=attrib]New Scientist:[end-div]

An analysis of the relationships between 43,000 transnational corporations has identified a relatively small group of companies, mainly banks, with disproportionate power over the global economy.

The study’s assumptions have attracted some criticism, but complex systems analysts contacted by New Scientist say it is a unique effort to untangle control in the global economy. Pushing the analysis further, they say, could help to identify ways of making global capitalism more stable.

The idea that a few bankers control a large chunk of the global economy might not seem like news to New York’s Occupy Wall Street movement and protesters elsewhere (see photo). But the study, by a trio of complex systems theorists at the Swiss Federal Institute of Technology in Zurich, is the first to go beyond ideology to empirically identify such a network of power. It combines the mathematics long used to model natural systems with comprehensive corporate data to map ownership among the world’s transnational corporations (TNCs).

“Reality is so complex, we must move away from dogma, whether it’s conspiracy theories or free-market,” says James Glattfelder. “Our analysis is reality-based.”

Previous studies have found that a few TNCs own large chunks of the world’s economy, but they included only a limited number of companies and omitted indirect ownerships, so could not say how this affected the global economy – whether it made it more or less stable, for instance.

The Zurich team can. From Orbis 2007, a database listing 37 million companies and investors worldwide, they pulled out all 43,060 TNCs and the share ownerships linking them. Then they constructed a model of which companies controlled others through shareholding networks, coupled with each company’s operating revenues, to map the structure of economic power.

The work, to be published in PLoS One, revealed a core of 1318 companies with interlocking ownerships (see image). Each of the 1318 had ties to two or more other companies, and on average they were connected to 20. What’s more, although they represented 20 per cent of global operating revenues, the 1318 appeared to collectively own through their shares the majority of the world’s large blue chip and manufacturing firms – the “real” economy – representing a further 60 per cent of global revenues.

When the team further untangled the web of ownership, it found much of it tracked back to a “super-entity” of 147 even more tightly knit companies – all of their ownership was held by other members of the super-entity – that controlled 40 per cent of the total wealth in the network. “In effect, less than 1 per cent of the companies were able to control 40 per cent of the entire network,” says Glattfelder. Most were financial institutions. The top 20 included Barclays Bank, JPMorgan Chase & Co, and The Goldman Sachs Group.

[div class=attrib]Read the entire article here.[end-div]

[div class=attrib]Image courtesy of New Scientist / PLoS One. The 1318 transnational corporations that form the core of the economy. Superconnected companies are red, very connected companies are yellow. The size of the dot represents revenue.[end-div]

The Myth of Bottled Water

In 2010 the world spent around $50 Billion on bottled water, with over a third accounted for by the United States alone. During this period the United States House of Representatives spent $860,000 on bottled water for its 435 members. This is close to $2,000 per person per year. (Figures according to Corporate Accountability International).

This is despite the fact that on average bottled water costs around 1,900 times more than it’s cheaper, less glamorous sibling — tap water. Bottled water has become a truly big business even though science shows no discernible benefit of bottled water over that from the faucet. In fact, around 40 percent of bottled water comes from municipal water supplies anyway.

In 2007 Charles Fishman wrote a ground-breaking cover story on the bottled water industry for Fast Company. We excerpt part of the article, Message in a Bottle, below.

[div class=attrib]By Charles Fishman:[end-div]

The largest bottled-water factory in North America is located on the outskirts of Hollis, Maine. In the back of the plant stretches the staging area for finished product: 24 million bottles of Poland Spring water. As far as the eye can see, there are double-stacked pallets packed with half-pint bottles, half-liters, liters, “Aquapods” for school lunches, and 2.5-gallon jugs for the refrigerator.

Really, it is a lake of Poland Spring water, conveniently celled off in plastic, extending across 6 acres, 8 feet high. A week ago, the lake was still underground; within five days, it will all be gone, to supermarkets and convenience stores across the Northeast, replaced by another lake’s worth of bottles.

Looking at the piles of water, you can have only one thought: Americans sure are thirsty.

Bottled water has become the indispensable prop in our lives and our culture. It starts the day in lunch boxes; it goes to every meeting, lecture hall, and soccer match; it’s in our cubicles at work; in the cup holder of the treadmill at the gym; and it’s rattling around half-finished on the floor of every minivan in America. Fiji Water shows up on the ABC show Brothers & Sisters; Poland Spring cameos routinely on NBC’s The Office. Every hotel room offers bottled water for sale, alongside the increasingly ignored ice bucket and drinking glasses. At Whole Foods, the upscale emporium of the organic and exotic, bottled water is the number-one item by units sold.

Thirty years ago, bottled water barely existed as a business in the United States. Last year, we spent more on Poland Spring, Fiji Water, Evian, Aquafina, and Dasani than we spent on iPods or movie tickets–$15 billion. It will be $16 billion this year.

Bottled water is the food phenomenon of our times. We–a generation raised on tap water and water fountains–drink a billion bottles of water a week, and we’re raising a generation that views tap water with disdain and water fountains with suspicion. We’ve come to pay good money–two or three or four times the cost of gasoline–for a product we have always gotten, and can still get, for free, from taps in our homes.

When we buy a bottle of water, what we’re often buying is the bottle itself, as much as the water. We’re buying the convenience–a bottle at the 7-Eleven isn’t the same product as tap water, any more than a cup of coffee at Starbucks is the same as a cup of coffee from the Krups machine on your kitchen counter. And we’re buying the artful story the water companies tell us about the water: where it comes from, how healthy it is, what it says about us. Surely among the choices we can make, bottled water isn’t just good, it’s positively virtuous.

Except for this: Bottled water is often simply an indulgence, and despite the stories we tell ourselves, it is not a benign indulgence. We’re moving 1 billion bottles of water around a week in ships, trains, and trucks in the United States alone. That’s a weekly convoy equivalent to 37,800 18-wheelers delivering water. (Water weighs 81/3 pounds a gallon. It’s so heavy you can’t fill an 18-wheeler with bottled water–you have to leave empty space.)

Meanwhile, one out of six people in the world has no dependable, safe drinking water. The global economy has contrived to deny the most fundamental element of life to 1 billion people, while delivering to us an array of water “varieties” from around the globe, not one of which we actually need. That tension is only complicated by the fact that if we suddenly decided not to purchase the lake of Poland Spring water in Hollis, Maine, none of that water would find its way to people who really are thirsty.

[div class=attrib]Please read the entire article here.[end-div]

[div class=attrib]Image courtesy of Wikipedia.[end-div]

Book Review: The Big Thirst. Charles Fishman

Charles Fishman has a fascinating new book entitled The Big Thirst: The Secret Life and Turbulent Future of Water. In it Fishman examines the origins of water on our planet and postulates an all to probable future where water becomes an increasingly limited and precious resource.

[div class=attrib]A brief excerpt from a recent interview, courtesy of NPR:[end-div]

For most of us, even the most basic questions about water turn out to be stumpers.

Where did the water on Earth come from?

Is water still being created or added somehow?

How old is the water coming out of the kitchen faucet?

For that matter, how did the water get to the kitchen faucet?

And when we flush, where does the water in the toilet actually go?

The things we think we know about water — things we might have learned in school — often turn out to be myths.

We think of Earth as a watery planet, indeed, we call it the Blue Planet; but for all of water’s power in shaping our world, Earth turns out to be surprisingly dry. A little water goes a long way.

We think of space as not just cold and dark and empty, but as barren of water. In fact, space is pretty wet. Cosmic water is quite common.

At the most personal level, there is a bit of bad news. Not only don’t you need to drink eight glasses of water every day, you cannot in any way make your complexion more youthful by drinking water. Your body’s water-balance mechanisms are tuned with the precision of a digital chemistry lab, and you cannot possibly “hydrate” your skin from the inside by drinking an extra bottle or two of Perrier. You just end up with pee sourced in France.

In short, we know nothing of the life of water — nothing of the life of the water inside us, around us, or beyond us. But it’s a great story — captivating and urgent, surprising and funny and haunting. And if we’re going to master our relationship to water in the next few decades — really, if we’re going to remaster our relationship to water — we need to understand the life of water itself.

[div class=attrib]Read more of this article and Charles Fishman’s interview with NPR here.[end-div]