Tag Archives: infographic

MondayMap: Food Rhythms

rhythm-of-food-screenshot

OK, I admit it. Today’s article is not strictly about a map, but I couldn’t resist these fascinating data visualizations. The graphic show some of the patterns and trends that can be derived from the vast mountains of data gathered from Google searches. A group of designers and data scientists from Truth & Beauty teamed up with Google News Labs to produce a portfolio of charts that show food and drink related searches over the last 12 years.

The visual above shows a clear spike in cocktail related searches in December (for entertaining during holiday season). Interestingly Searches for a “Tom Collins” have increased since 2004 whereas those for “Martini” have decreased in number. A more recent phenomenon on the cocktail scene seems to be the “Moscow Mule”.

Since most of the searches emanated in the United States the resulting charts show some fascinating changes in the nation’s collective nutritional mood. While some visualizations confirm the obvious — fruit searches peak when in season; pizza is popular year round — some  specific insights are more curious:

  • Orange Jell-O [“jelly” for my British readers] is popular for US Thanksgiving.
  • Tamale searches peak around Christmas.
  • Pumpkin spice latte searches increase in the fall, but searches are peaking earlier each year.
  • Superfood searches are up; fat-free searches are down.
  • Nacho searches peak around Super Bowl Sunday.
  • Cauliflower may be the new Kale.

You can check out much more from this gorgeous data visualization project at The Rhythm of Food.

Image: Screenshot from Rhythm of Food. Courtesy: Rhythm of Food.

MondayMap: Red Versus Blue

1883-county-map

You may believe that colorful, graphical electoral analysis is a relatively recent phenomenon. You know, those cool red and blue maps (and now sometimes green or purple) of each state and country.

But our present day news networks and the internet did not invent this type of infographic map.

Susan Schulten, chair of the history department at the University of Denver, discovered what may be the earliest example of a US county-level electoral map. Published in 1883 it shows results from the 1880 Presidential election between Republican James Garfield and Democrat Winfield Hancock. Garfield won.

Two notable reversals in the 1880 map versus today’s counterpart: First, Democrats are in red; Republicans in blue. Second, Democrats make up the majority in much of the South and Midwest; Republicans rule in the Northeast. Interestingly, the color scheme switched numerous times over the last hundred years and did not formally become Democrat=Blue, Republican=Red until the 2000 election cycle.

For more fascinating details of our electoral maps, past and present, check out this article by Lazaro Gamio, over at the Washington Post.

Image: Plate 11 from Scribner’s Statistical Atlas of the United States, published in 1883. Courtesy: Library of Congress. Public Domain.

Psychopath Versus Sociopath

psycopath-vs-sociopath-infographic1

I’ve been writing for a while now about a certain person who wishes to become the next President of the United States. His name is Donald Trump. He carries with him an entire encyclopedia — no, bookshelves of encyclopedias — of negative character traits. But chief among these he lacks empathy, tends to feel no guilt or remorse, and disregards the needs and rights of others. These are traits common to both psychopaths and sociopaths.

Over the last few years I’ve been describing Mr. Trump as a psychopath. Others, particularly recently (here, here, here), characterize him as a sociopath. Who’s right?

I’m turning to some psychological resources, excerpted and paraphrased below — American Psychological Association, Psychology Today, WebMD — to help me clarify the differences.

On first analysis it looks like Mr. Trump straddles both! Though I must say, that regardless, I don’t want either a sociopath or a psychopath, or a psycho-sociopath or a socio-psychopath in the White House with fingers anywhere close to the nuclear codes.

Sociopath:

Sociopaths tend to be volatile. That is, they tend to be nervous and easily agitated or angered. They are volatile and prone to emotional outbursts, including fits of rage. In addition, they may be uneducated and live on the fringes of traditional society, unable to hold down a steady job or stay in one place for very long. They are frequently transients and drifters.

It is difficult but not impossible for sociopaths to form attachments with others. They are capable of bonding emotionally and demonstrating empathy with certain people in certain situations but not others. Many sociopaths have no regard for society in general or its rules. Sociopathy, on the other hand, is more likely the product of environmental influences (“nurture”), such as childhood trauma and physical/emotional abuse.

Psychopath:

Psychopaths are unable to form emotional attachments or feel real empathy with others, although they often have disarming or even charming personalities. Psychopaths are very manipulative and can easily gain people’s trust. They learn to mimic emotions, despite their inability to actually feel them, and will appear normal to unsuspecting people. Psychopaths are often well educated and hold steady jobs. Some are so good at manipulation and mimicry that they have families and other long-term relationships without those around them ever suspecting their true nature.

It is believed that psychopathy is the largely the result of “nature” (genetics) and is related to a physiological defect that results in the underdevelopment of the part of the brain responsible for impulse control and emotions.

Infographic courtesy of Psychologia.

World Happiness Ranking

national-happiness-2015

Yet again, nations covering the northern latitudes outrank all others on this year’s global happiness scale. Not surprisingly, Denmark topped the happiness list in 2015, having secured the top spot since 2012, except for 2014 when it was pipped by Switzerland. The top 5 for 2015 are: Denmark, Iceland, Norway, Finland, and Canada.

The report finds that the happiest nations tend to be those with lower income disparity and strong national health and social safety programs. Ironically, richer nations, including the United States, tend to rank lower due to rising inequalities in income, wealth and health.

That said, the United States moved to No. 13, up two places from No. 15 the previous year. This is rather perplexing considering all the anger that we’re hearing about during the relentless 2016 presidential election campaign.

At the bottom of the list of 157 nations is Burundi, recently torn by a violent political upheaval. The bottom five nations for 2015 are: Benin, Afghanistan, Togo, Syria and Burundi; all have recently suffered from war or disease or both.

The happiness score for each nation is based on multiple national surveys covering a number of criteria, which are aggregated into six key measures: GDP per capita, social support; healthy life expectancy; freedom to make life choices; generosity; and perceptions of corruption.

The World Happiness Report was prepared by the Sustainable Development Solutions Network, an international group of social scientists and public health experts under the auspices of the United Nations.

Read more on the report here.

Image: Top 30 nations ranked for happiness, screenshot. Courtesy: World Happiness Report, The Distribution of World Happiness, by John F. Helliwell, Canadian Institute for Advanced Research and Vancouver School of Economics, University of British Columbia; Haifang Huang, Department of Economics, University of Alberta; Shun Wang, KDI School of Public Policy and Management, South Korea.

Time For Another Candlelight Vigil

Another day, another mass shooting. Only in the United States do citizens and their political leaders take action to counter terrorism but sit idly by when it comes to tackling the enormity of domestic gun violence. Soon, no doubt, we’ll hear of a child accidentally killing his younger sibling with a handgun. On it goes.

So, here’s yet another infographic — courtesy of Wired — on the subject, which puts the scale of this abhorrent and relentless tragedy quite starkly.

Between 2003 and 2013, domestic and international terrorism killed 312 US citizens. During that same period, in the US, 346,681 people died at the hands of someone with a gun. That’s over 31,500 gun deaths per year. Gotta have those guns!

Yet this is the difference in reactions: when the perpetrator is a foreign terrorist we deploy the full force of the US, be it drones, NSA, CIA, FBI, our armed services; when it’s a raging neighbor with a gun we hold a candlelight vigil.

If you want to take some action beyond reciting a few prayers and lighting a candle, please visit Americans For Responsible Solutions. Remember, if we sit idly by, we are complicit.

guns_terrorism_final

Infographic courtesy of Wired.


Atheists Growing, But Still Remain Hated

infographic-atheism-2014

While I’ve lived in the United States for quite some time now it continues to perplex. It may still be a land of opportunity, but it remains a head-scratching paradox. Take religion. On the one hand, a recent survey by the Pew Research Center found that 22.8 percent of the adult population has no religious affiliation. That is, almost one quarter is atheist, agnostic or has no identification with any organized religion. This increased from 16 percent a mere seven years earlier. Yet, on the other hand, atheists and non-believers make up one of the most hated groups in the country — second only to Muslims. And, I don’t know where Satanists figure in this analysis.

Pew’s analysis also dices the analysis by political affiliation, and to no surprise, finds that Republicans generally hate atheists more than those on the left of the political spectrum. For Pew’s next research effort I would suggest they examine which religious affiliations hate atheists the most.

From the Guardian:

The dominant Christian share of the American population is falling sharply while the number of US adults who do not believe in God or prefer not to identify with any organized religion is growing significantly, according to a new report.

The trend is affecting Americans across the country and across all demographics and age groups – but is especially pronounced among young people, the survey by the Pew Research Center found.

In the last seven years, the proportion of US adults declaring themselves Christian fell from 78.4% to 70.6%, with the mainstream protestant, Catholic and evangelical protestant faiths all affected.

Over the same period, those in the category that Pew labeled religiously “unaffiliated” – those describing themselves as atheist, agnostic or “nothing in particular” – jumped from 16.1% of the population to between a fifth and a quarter, at 22.8%, the report, released on Tuesday, found.

“The US remains home to more Christians than any other country in the world, and a large majority of Americans continue to identify with some branch of the Christian faith, but the percentage of adults who describe themselves as Christians has dropped by almost eight points since 2007,” the survey found.

The change in non-Christian religious faiths, including Jews, Muslims, Buddhists, Hindus and “other world religions and faiths” crept up modestly from 4.7% to 5.9% of US adults.

“The younger generation seem much less involved in organized religion and the older generation is passing on, which is a very important factor,” John Green, a professor of political science at the University of Akron in Ohio and an adviser on the survey, told the Guardian.

Tuesday’s report is called the Religious Landscape Study and is the second of its kind prepared by the Pew Research Center.

Pew first conducted such a survey in 2007 and repeated it in 2014 then made comparisons.

The US census does not ask Americans to specify their religion, and there are no official government statistics on the religious composition of the US population, the report pointed out, adding that researchers gathered their material by conducting the survey in Spanish and English across a nationally representative sample of 35,000 US adults.

Green said there were a number of different theories behind more young people eschewing organized religion.

“The involvement of religious groups in politics, particularly regarding issues such as same sex marriage and abortion, is alienating younger adults, who tend to have more liberal and progressive views than older people,” he said.

The rise of the internet and social media has also drawn younger adults towards online, general social groups and away from face-to-face organizations and traditional habits, such as churchgoing, he said.

And there is a theory that the fact that more young people in this generation are going to college is linked to their falling interest in organized religion, he said.

Read the entire story here.

Infographic courtesy of the Pew Research Center.

World Population: 100

World-as-100-People

Take today’s world and shrink its population down to just 100 people. Then apply a range of global measures to this group. Voila! You get a fascinating view of humanity at a scale that your brain can comprehend. For instance, from the total of a 100 people: 48 live on less than $2 per day, 93 do not have a college degree, 16 are undernourished or starving, 23 have no shelter, and 17 are illiterate.

The infographic was designed by graphic designer Jack Hagley. You can check out the infographic and read more of Hagley’s work here.

Infographic courtesy of Jack Hagley.

Gun Love

Gun Violence in America

The second amendment remains ever strong in the U.S. And, of course so does the number of homicides and child deaths at the hands of guns. Sigh!

From the Guardian:

In February, a nine-year-old Arkansas boy called Hank asked his uncle if he could head off on his own from their remote camp to hunt a rabbit with his .22 calibre rifle. “I said all right,” recalled his uncle Brent later. “It wasn’t a concern. Some people are like, ‘a nine year old shouldn’t be off by himself,’ but he wasn’t an average nine year old.”

Hank was steeped in hunting: when he was two, his father, Brad, would put him in a rucksack on his back when he went turkey hunting. Brad regularly took Hank hunting and said that his son often went off hunting by himself. On this particular day, Hank and his uncle Brent had gone squirrel hunting together as his father was too sick to go.

When Hank didn’t return from hunting the rabbit, his uncle raised the alarm. His mother, Kelli, didn’t learn about his disappearance for seven hours. “They didn’t want to bother me unduly,” she says.

The following morning, though, after police, family and hundreds of locals searched around the camp, Hank’s body was found by a creek with a single bullet wound to the forehead. The cause of death was, according to the police, most likely a hunting accident.

“He slipped and the butt of the gun hit the ground and the gun fired,” says Kelli.

Kelli had recently bought the gun for Hank. “It was the first gun I had purchased for my son, just a youth .22 rifle. I never thought it would be a gun that would take his life.”

Both Kelli and Brad, from whom she is separated, believe that the gun was faulty – it shouldn’t have gone off unless the trigger was pulled, they claim. Since Hank’s death, she’s been posting warnings on her Facebook page about the gun her son used: “I wish someone else had posted warnings about it before what happened,” she says.

Had Kelli not bought the gun and had Brad not trained his son to use it, Hank would have celebrated his 10th birthday on 6 June, which his mother commemorated by posting Hank’s picture on her Facebook page with the message: “Happy Birthday Hank! Mommy loves you!”

Little Hank thus became one in a tally of what the makers of a Channel 4 documentary called Kids and Guns claim to be 3,000 American children who die each year from gun-related accidents. A recent Yale University study found that more than 7,000 US children and adolescents are hospitalised or killed by guns each year and estimates that about 20 children a day are treated in US emergency rooms following incidents involving guns.

Hank’s story is striking, certainly for British readers, for two reasons. One, it dramatises how hunting is for many Americans not the privileged pursuit it is overwhelmingly here, but a traditional family activity as much to do with foraging for food as it is a sport.

Francine Shaw, who directed Kids and Guns, says: “In rural America … people hunt to eat.”

Kelli has a fond memory of her son coming home with what he’d shot. “He’d come in and say: “Momma – I’ve got some squirrel to cook.” And I’d say ‘Gee, thanks.’ That child was happy to bring home meat. He was the happiest child when he came in from shooting.”

But Hank’s story is also striking because it shows how raising kids to hunt and shoot is seen as good parenting, perhaps even as an essential part of bringing up children in America – a society rife with guns and temperamentally incapable of overturning the second amendment that confers the right to bear arms, no matter how many innocent Americans die or get maimed as a result.

“People know I was a good mother and loved him dearly,” says Kelli. “We were both really good parents and no one has said anything hateful to us. The only thing that has been said is in a news report about a nine year old being allowed to hunt alone.”

Does Kelli regret that Hank was allowed to hunt alone at that young age? “Obviously I do, because I’ve lost my son,” she tells me. But she doesn’t blame Brent for letting him go off from camp unsupervised with a gun.

“We’re sure not anti-gun here, but do I wish I could go back in time and not buy that gun? Yes I do. I know you in England don’t have guns. I wish I could go back and have my son back. I would live in England, away from the guns.”

Read the entire article here.

Infographic courtesy of Care2 via visua.ly

MondayMap: Mississippi is Syria; Colorado is Slovenia

US-life-expectancy

A fascinating map re-imagines life expectancy in the United States, courtesy of Olga Khazan over at measureofamerica.org. The premise of this map is a simple one: match the average life expectancy for each state of the union with that of a country having a similar rate. Voila. The lowest life expectancy rate belongs to Mississippi at 75 years, which equates with that of Syria. The highest, at 81.3 years, is found in Hawaii and Cyprus.

From the Atlantic:

American life expectancy has leapt up some 30 years in the past century, and we now live roughly 79.8 years on average. That’s not terrible, but it’s not fantastic either: We rank 35th in the world as far as lifespan, nestled right between Costa Rica and Chile. But looking at life expectancy by state, it becomes clear that where you live in America, at least to some extent, determines when you’ll die.

Here, I’ve found the life expectancy for every state to the tenth of a year using the data and maps from the Measure of America, a nonprofit group that tracks human development. Then, I paired it up with the nearest country by life expectancy from the World Health Organization’s 2013 data. When there was no country with that state’s exact life expectancy, I paired it with the nearest matching country, which was always within two-tenths of a year.

There’s profound variation by state, from a low of 75 years in Mississippi to a high of 81.3 in Hawaii. Mostly, we resemble tiny, equatorial hamlets like Kuwait and Barbados. At our worst, we look more like Malaysia or Oman, and at our best, like the United Kingdom. No state approaches the life expectancies of most European countries or some Asian ones. Icelandic people can expect to live a long 83.3 years, and that’s nothing compared to the Japanese, who live well beyond 84.

Life expectancy can be causal, a factor of diet, environment, medical care, and education. But it can also be recursive: People who are chronically sick are less likely to become wealthy, and thus less likely to live in affluent areas and have access to the great doctors and Whole-Foods kale that would have helped them live longer.

It’s worth noting that the life expectancy for certain groups within the U.S. can be much higher—or lower—than the norm. The life expectancy for African Americans is, on average, 3.8 years shorter than that of whites. Detroit has a life expectancy of just 77.6 years, but that city’s Asian Americans can expect to live 89.3 years.

Read the entire article here.

Cut the Buzzwords

Social network LinkedIn has just published a neat infographic showing the use, misuse and over-use of buzzwords in its members’ personal profiles. If your profile included such nuggets as: motivated, multinational and specialized, well, it’s probably time to freshen up the resume.

Our votes for the most overused buzzwords of 2013 would go to: innovation, redemption, sustainable and our favorite — big data.

infographic-linkedin-buzzwordsInfographic courtesy of LinkedIn.

Lost in Transit

Next time you are stuck at an airport due to a delayed flight or an ill-timed connection, rather than finding a quiet spot near a wall outlet (to charge one of your 10 electrical devices), try something different. Some airports offer some fascinating distractions for stressed-out fliers.

From the Telegraph:

Modern air travellers can pet a “therapy dog”, attend a concert, have their teeth whitened or admire a 42-foot statue of Gollum.

Other options include yoga and meditation for health-conscious holidaymakers (Dallas Fort Worth and Albuquerque airports, respectively) and massages for anxious fliers (New Delhi), while Hong Kong International boasts an iMax cinema.

A list of unusual activities was compiled by CheapFlights.co.uk, the travel comparison website, for its infographic “50 things to do when you’re stuck at an airport”.

Here are some of the most bizarre and surprising airport features:

– Ping Pong – tables are set up at Milwaukee’s Mitchell Airport

– Swim – a swimming pool and Jacuzzi are available to passengers at Singapore’s Changi Airport

– Health check – teeth whitening, blood pressure testing and expert physicians are all available at Incheon Airport

– Gollum – a 42-foot statue of Gollum from Lord of the Rings sits catching a fish in Wellington Airport

– Fish – Vancouver Airport has an aquarium and a jellyfish exhibit

– The stars – Tokyo’s Haneda Airport boasts its own planetarium

– A dinosaur – a 10-foot-tall, 31-foot-long Yangchuanosaurus greets passengers at Atlanta’s Hartsfield-Jackson Airport

– Sleep – take advantage of specially designed ‘sleeping chairs’ in Seoul, Singapore or Amsterdam

– Snuggle with a dog – at Miami International, Casey the therapy dog wanders the terminal with her owner. Anyone is welcome to touch her

– Toilets – from Hello Kitty-themed restrooms in Taipei to futuristic electronic toilets in Tokyo, airport bathrooms have plenty of interesting facilities

– Nature – pay a visit to the rainforest without leaving the airport. A section of jungle has been transplanted into Kuala Lumpur

– Ice Skating – Seoul Incheon offers a synthetic ice rink

Read the entire article here.

Inforgraphic courtesy of Cheapflights.

MondayMap: Human History

How does one condense four thousand years of human history into a single view? Well, John Sparks did just that with his histomap in 1931.

From Slate:

This “Histomap,” created by John B. Sparks, was first printed by Rand McNally in 1931. (The David Rumsey Map Collection hosts a fully zoomable version here.) (Update: Click on the image below to arrive at a bigger version.)

This giant, ambitious chart fit neatly with a trend in nonfiction book publishing of the 1920s and 1930s: the “outline,” in which large subjects (the history of the world! every school of philosophy! all of modern physics!) were distilled into a form comprehensible to the most uneducated layman.

The 5-foot-long Histomap was sold for $1 and folded into a green cover, which featured endorsements from historians and reviewers. The chart was advertised as “clear, vivid, and shorn of elaboration,” while at the same time capable of “holding you enthralled” by presenting:

the actual picture of the march of civilization, from the mud huts of the ancients thru the monarchistic glamour of the middle ages to the living panorama of life in present day America.

The chart emphasizes domination, using color to show how the power of various “peoples” (a quasi-racial understanding of the nature of human groups, quite popular at the time) evolved throughout history.

It’s unclear what the width of the colored streams is meant to indicate. In other words, if the Y axis of the chart clearly represents time, what does the X axis represent? Did Sparks see history as a zero-sum game, in which peoples and nations would vie for shares of finite resources? Given the timing of his enterprise—he made this chart between two world wars and at the beginning of a major depression—this might well have been his thinking.

Sparks followed up on the success of this Histomap by publishing at least two more: the Histomap of religion (which I’ve been unable to find online) and the Histomap of evolution.

Read the entire article a check out the zoomable histomap here.

Worst Job in the World

Would you rather be a human automaton inside a Chinese factory making products for your peers or a banquet attendant in ancient Rome? Thanks to Lapham’s Quarterly for this disturbing infographic, which shows how times may not have changed as much as we would have believed for the average worker over the last 2,000 years.

Visit the original infographic here.

Infographic courtesy of Lapham’s Quarterly.

Big Data and Even Bigger Problems

First a definition. Big data: typically a collection of large and complex datasets that are too cumbersome to process and analyze using traditional computational approaches and database applications. Usually the big data moniker will be accompanied by an IT vendor’s pitch for shiny new software (and possible hardware) solution able to crunch through petabytes (one petabyte is a million gigabytes) of data and produce a visualizable result that mere mortals can decipher.

Many companies see big data and related solutions as a panacea to a range of business challenges: customer service, medical diagnostics, product development, shipping and logistics, climate change studies, genomic analysis and so on. A great example was the last U.S. election. Many political wonks — from both sides of the aisle — agreed that President Obama was significantly aided in his won re-election with the help of big data. So, with that in mind, many are now looking at more important big data problems.

From Technology Review:

As chief scientist for President Obama’s reëlection effort, Rayid Ghani helped revolutionize the use of data in politics. During the final 18 months of the campaign, he joined a sprawling team of data and software experts who sifted, collated, and combined dozens of pieces of information on each registered U.S. voter to discover patterns that let them target fund-raising appeals and ads.

Now, with Obama again ensconced in the Oval Office, some veterans of the campaign’s data squad are applying lessons from the campaign to tackle social issues such as education and environmental stewardship. Edgeflip, a startup Ghani founded in January with two other campaign members, plans to turn the ad hoc data analysis tools developed for Obama for America into software that can make nonprofits more effective at raising money and recruiting volunteers.

Ghani isn’t the only one thinking along these lines. In Chicago, Ghani’s hometown and the site of Obama for America headquarters, some campaign members are helping the city make available records of utility usage and crime statistics so developers can build apps that attempt to improve life there. It’s all part of a bigger idea to engineer social systems by scanning the numerical exhaust from mundane activities for patterns that might bear on everything from traffic snarls to human trafficking. Among those pursuing such humanitarian goals are startups like DataKind as well as large companies like IBM, which is redrawing bus routes in Ivory Coast (see “African Bus Routes Redrawn Using Cell-Phone Data”), and Google, with its flu-tracking software (see “Sick Searchers Help Track Flu”).

Ghani, who is 35, has had a longstanding interest in social causes, like tutoring disadvantaged kids. But he developed his data-mining savvy during 10 years as director of analytics at Accenture, helping retail chains forecast sales, creating models of consumer behavior, and writing papers with titles like “Data Mining for Business Applications.”

Before joining the Obama campaign in July 2011, Ghani wasn’t even sure his expertise in machine learning and predicting online prices could have an impact on a social cause. But the campaign’s success in applying such methods on the fly to sway voters is now recognized as having been potentially decisive in the election’s outcome (see “A More Perfect Union”).

“I realized two things,” says Ghani. “It’s doable at the massive scale of the campaign, and that means it’s doable in the context of other problems.”

At Obama for America, Ghani helped build statistical models that assessed each voter along five axes: support for the president; susceptibility to being persuaded to support the president; willingness to donate money; willingness to volunteer; and likelihood of casting a vote. These models allowed the campaign to target door knocks, phone calls, TV spots, and online ads to where they were most likely to benefit Obama.

One of the most important ideas he developed, dubbed “targeted sharing,” now forms the basis of Edgeflip’s first product. It’s a Facebook app that prompts people to share information from a nonprofit, but only with those friends predicted to respond favorably. That’s a big change from the usual scattershot approach of posting pleas for money or help and hoping they’ll reach the right people.

Edgeflip’s app, like the one Ghani conceived for Obama, will ask people who share a post to provide access to their list of friends. This will pull in not only friends’ names but also personal details, like their age, that can feed models of who is most likely to help.

Say a hurricane strikes the southeastern United States and the Red Cross needs clean-up workers. The app would ask Facebook users to share the Red Cross message, but only with friends who live in the storm zone, are young and likely to do manual labor, and have previously shown interest in content shared by that user. But if the same person shared an appeal for donations instead, he or she would be prompted to pass it along to friends who are older, live farther away, and have donated money in the past.

Michael Slaby, a senior technology official for Obama who hired Ghani for the 2012 election season, sees great promise in the targeted sharing technique. “It’s one of the most compelling innovations to come out of the campaign,” says Slaby. “It has the potential to make online activism much more efficient and effective.”

For instance, Ghani has been working with Fidel Vargas, CEO of the Hispanic Scholarship Fund, to increase that organization’s analytical savvy. Vargas thinks social data could predict which scholarship recipients are most likely to contribute to the fund after they graduate. “Then you’d be able to give away scholarships to qualified students who would have a higher probability of giving back,” he says. “Everyone would be much better off.”

Ghani sees a far bigger role for technology in the social sphere. He imagines online petitions that act like open-source software, getting passed around and improved. Social programs, too, could get constantly tested and improved. “I can imagine policies being designed a lot more collaboratively,” he says. “I don’t know if the politicians are ready to deal with it.” He also thinks there’s a huge amount of untapped information out there about childhood obesity, gang membership, and infant mortality, all ready for big data’s touch.

Read the entire article here.

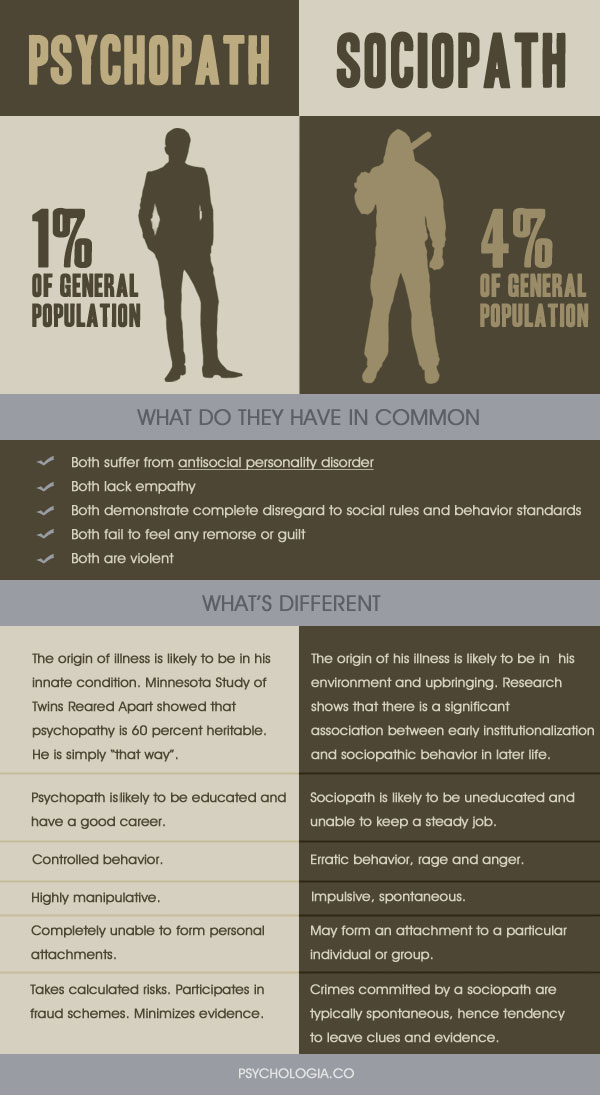
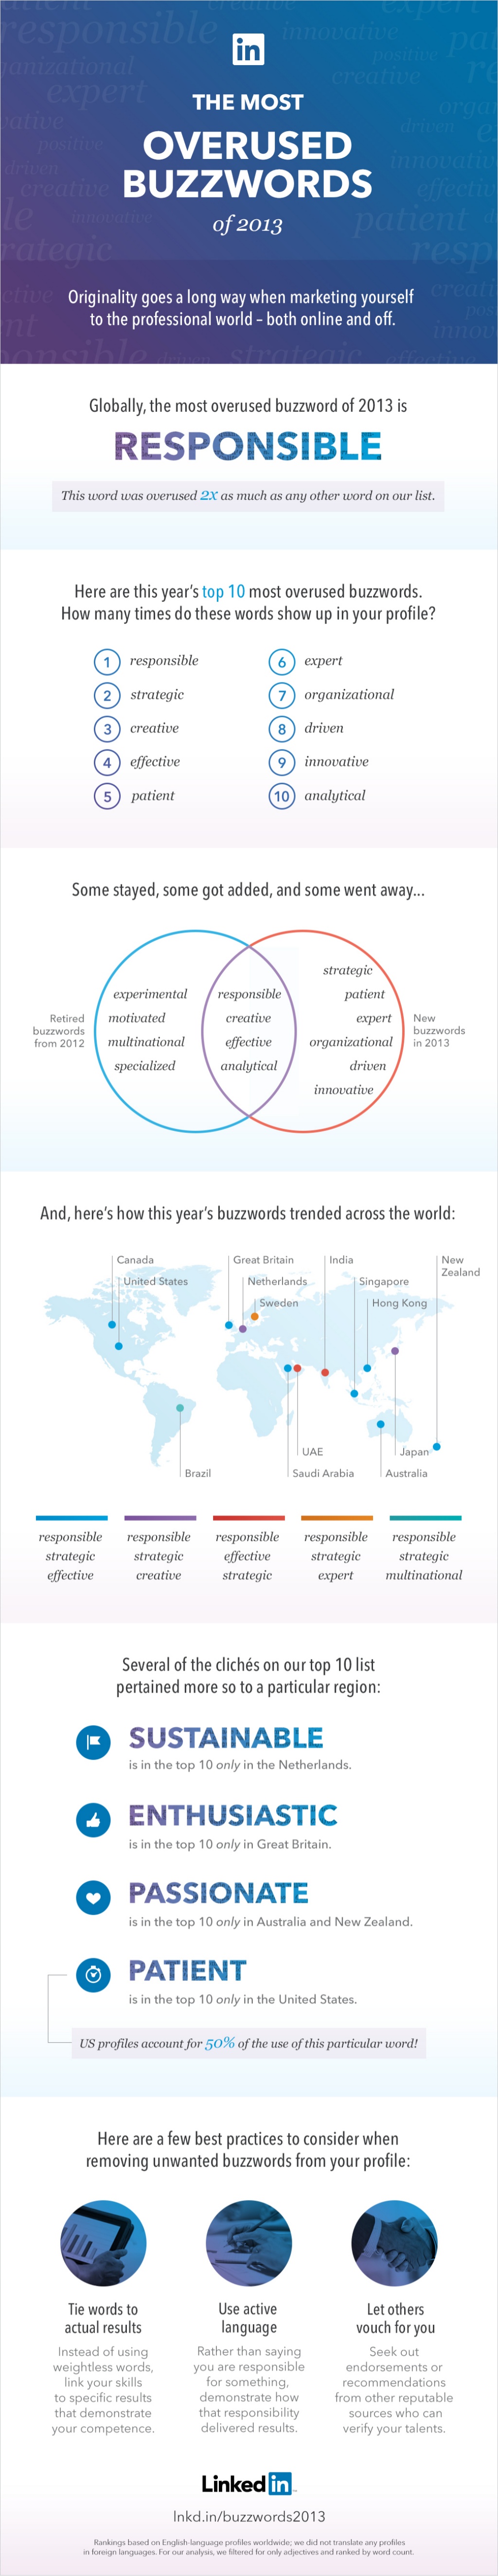
Inforgraphic courtesy of visua.ly. See the original here.

MondayMap: Global Intolerance

Following on from last week’s MondayMap post on intolerance and hatred within the United States — according to tweets on the social media site Twitter — we expand our view this week to cover the globe. This map is a based on a more detailed, global research study of people’s attitudes to having neighbors of a different race.

From the Washington Post:

When two Swedish economists set out to examine whether economic freedom made people any more or less racist, they knew how they would gauge economic freedom, but they needed to find a way to measure a country’s level of racial tolerance. So they turned to something called the World Values Survey, which has been measuring global attitudes and opinions for decades.

Among the dozens of questions that World Values asks, the Swedish economists found one that, they believe, could be a pretty good indicator of tolerance for other races. The survey asked respondents in more than 80 different countries to identify kinds of people they would not want as neighbors. Some respondents, picking from a list, chose “people of a different race.” The more frequently that people in a given country say they don’t want neighbors from other races, the economists reasoned, the less racially tolerant you could call that society. (The study concluded that economic freedom had no correlation with racial tolerance, but it does appear to correlate with tolerance toward homosexuals.)

Unfortunately, the Swedish economists did not include all of the World Values Survey data in their final research paper. So I went back to the source, compiled the original data and mapped it out on the infographic above. In the bluer countries, fewer people said they would not want neighbors of a different race; in red countries, more people did.

If we treat this data as indicative of racial tolerance, then we might conclude that people in the bluer countries are the least likely to express racist attitudes, while the people in red countries are the most likely.

Update: Compare the results to this map of the world’s most and least diverse countries.

Before we dive into the data, a couple of caveats. First, it’s entirely likely that some people lied when answering this question; it would be surprising if they hadn’t. But the operative question, unanswerable, is whether people in certain countries were more or less likely to answer the question honestly. For example, while the data suggest that Swedes are more racially tolerant than Finns, it’s possible that the two groups are equally tolerant but that Finns are just more honest. The willingness to state such a preference out loud, though, might be an indicator of racial attitudes in itself. Second, the survey is not conducted every year; some of the results are very recent and some are several years old, so we’re assuming the results are static, which might not be the case.

• Anglo and Latin countries most tolerant. People in the survey were most likely to embrace a racially diverse neighbor in the United Kingdom and its Anglo former colonies (the United States, Canada, Australia and New Zealand) and in Latin America. The only real exceptions were oil-rich Venezuela, where income inequality sometimes breaks along racial lines, and the Dominican Republic, perhaps because of its adjacency to troubled Haiti. Scandinavian countries also scored high.

• India, Jordan, Bangladesh and Hong Kong by far the least tolerant. In only three of 81 surveyed countries, more than 40 percent of respondents said they would not want a neighbor of a different race. This included 43.5 percent of Indians, 51.4 percent of Jordanians and an astonishingly high 71.8 percent of Hong Kongers and 71.7 percent of Bangladeshis.

Read more about this map here.

How We Die (In Britain)

The handy infographic is compiled from data compiled by the Office of National Statistics in the United Kingdom. So, if you live in the British Isles this will give you an inkling of your likely cause of death. Interestingly, if you live in the United States you are more likely to die of a gunshot wound than a Brit is of dying from falling from a building.

[div class=attrib]Read the entire article after the jump.[end-div]

[div class=attrib]Infographic courtesy of the Guardian.[end-div]

The United Swing States of America

Frank Jacobs over at Strange Maps has found a timely reminder that shows the inordinate influence that a few voters in several crucial States have over the rest of us.

[div class=attrib]From Strange Maps:[end-div]

At the stroke of midnight on November 6th, the 21 registered voters of Dixville Notch, gathering in the wood-panelled Ballot Room of the Balsams Grand Resort Hotel, will have just one minute to cast their vote. Speed is of the essence, if the tiny New Hampshire town is to uphold its reputation (est. 1960) as the first place to declare its results in the US presidential elections.

Later that day, well over 200 million other American voters will face the same choice as the good folks of the Notch: returning Barack Obama to the White House for a second and final four-year term, or electing Mitt Romney as the 45th President of the United States.

The winner of that contest will not be determined by whoever wins a simple majority (i.e. 50% of all votes cast, plus at least one). Like many electoral processes across the world, the system to elect the next president of the United States is riddled with idiosyncrasies and peculiarities – the quadrennial quorum in Dixville Notch being just one example.

Even though most US Presidents have indeed gained office by winning the popular vote, but this is not always the case. What is needed, is winning the electoral vote. For the US presidential election is an indirect one: depending on the outcome in each of the 50 states, an Electoral College convenes in Washington DC to elect the President.

The total of 538 electors is distributed across the states in proportion to their population size, and is regularly adjusted to reflect increases or decreases. In 2008 Louisiana had 9 electors and South Carolina had 8; reflecting a relative population decrease, resp. increase, those numbers are now reversed.

Maine and Nebraska are the only states to assign their electors proportionally; the other 48 states (and DC) operate on the ABBA principle: however slight the majority of either candidate in any of those states, he would win all its electoral votes. This rather convoluted system underlines the fact that the US Presidential elections are the sum of 50, state-level contests. It also brings into focus that some states are more important than others.

Obviously, in this system the more populous states carry much more weight than the emptier ones. Consider the map of the United States, and focus on the 17 states west of the straight-ish line of state borders from North Dakota-Minnesota in the north to Texas-Louisiana in the south. Just two states – Texas and California – outweigh the electoral votes of the 15 others.

So presidential candidates concentrate their efforts on the states where they can hope to gain the greatest advantage. This excludes the fairly large number of states that are solidly ‘blue’ (i.e. Democratic) or ‘red’ (Republican). Texas, for example, is reliably Republican, while California can be expected to fall in the Democratic column.

[div class=attrib]Read the entire article after the jump.[end-div]

[div class=attrib]Map courtesy of Strange Maps / Big Think.[end-div]

Mobile Phone as Survival Gear

So, here’s the premise. You have hiked alone for days and now find yourself isolated and lost in a dense forest half-way up a mountain. Yes! You have a cell phone. But, oh no, there is no service in this remote part of the world. So, no call for help and no GPS. And, it gets worse: you have no emergency supplies and no food. What can you do? The neat infographic offers some tips.

[div class=attrib]Infographic courtesy of Natalie Bracco / AnsonAlex.com.[end-div]

When to Eat Your Fruit and Veg

It’s time to jettison the $1.99 hyper-burger and super-sized fires and try some real fruits and vegetables. You know — the kind of product that comes directly from the soil. But, when is the best time to suck on a juicy peach or chomp some crispy radicchio?

A great chart, below, summarizes which fruits and vegetables are generally in season for the Northern Hemisphere.

[div class=attrib]Infographic courtesy of Visual News, designed by Column Five.[end-div]

Best Countries for Women

If you’re female and value lengthy life expectancy, comprehensive reproductive health services, sound education and equality with males, where should you live? In short, Scandinavia, Australia and New Zealand, and Northern Europe. In a list of the 44 most well-developed nations, the United States ranks towards the middle, just below Canada and Estonia, but above Greece, Italy, Russia and most of Central and Eastern Europe.

The fascinating infographic from the National Post does a great job of summarizing the current state of womens’ affairs from data gathered from 165 countries.

[div class=attrib]Read the entire article and find a higher quality infographic after the jump.[end-div]

Your Life Expectancy Mapped

Your life expectancy mapped, that is, if you live in London, U.K. So, take the iconic London tube (subway) map, then overlay it with figures for average life expectancy. Voila, you get to see how your neighbors on the Piccadilly Line fair in their longevity compared with say, you, who happen to live near a Central Line station. It turns out that in some cases adjacent areas — as depicted by nearby but different subway stations — show an astounding gap of more than 20 years in projected life span.

So, what is at work? And, more importantly, should you move to Bond Street where the average life expectancy is 96 years, versus only 79 in Kennington, South London?

[div class=attrib]From the Atlantic:[end-div]

Last year’s dystopian action flick In Time has Justin Timberlake playing a street rat who suddenly comes into a great deal of money — only the currency isn’t cash, it’s time. Hours and minutes of Timberlake’s life that can be traded just like dollars and cents in our world. Moving from poor districts to rich ones, and vice versa, requires Timberlake to pay a toll, each time shaving off a portion of his life savings.

Literally paying with your life just to get around town seems like — you guessed it — pure science fiction. It’s absolute baloney to think that driving or taking a crosstown bus could result in a shorter life (unless you count this). But a project by University College London researchers called Lives on the Line echoes something similar with a map that plots local differences in life expectancy based on the nearest Tube stop.

The trends are largely unsurprising, and correlate mostly with wealth. Britons living in the ritzier West London tend to have longer expected lifespans compared to those who live in the east or the south. Those residing near the Oxford Circus Tube stop have it the easiest, with an average life expectancy of 96 years. Going into less wealthy neighborhoods in south and east London, life expectancy begins to drop — though it still hovers in the respectable range of 78-79.

Meanwhile, differences in life expectancy between even adjacent stations can be stark. Britons living near Pimlico are predicted to live six years longer than those just across the Thames near Vauxhall. There’s about a two-decade difference between those living in central London compared to those near some stations on the Docklands Light Railway, according to the BBC. Similarly, moving from Tottenham Court Road to Holborn will also shave six years off the Londoner’s average life expectancy.

Michael Marmot, a UCL professor who wasn’t involved in the project, put the numbers in international perspective.

“The difference between Hackney and the West End,” Marmot told the BBC, “is the same as the difference between England and Guatemala in terms of life expectancy.”

[div class=atrib]Read the entire article after the jump.[end-div]

[div class=attrib]Image courtesy of Atlantic / MappingLondon.co.uk.[end-div]

Have a Laugh, Blame Twitter

Correlate 2 sets of totally independent statistics and you get to blame Twitter for most, if not all, of the world’s ills. That’s what Tim Cooley has done with this funny and informative #Blame Twitter infographic below.

Of course, even though the numbers are all verified and trusted, causation is entirely another factor. So, while 144,595 people die each day (on average), it is not (yet) as a result of using Twitter, and while our planet loses 1 hectare of forest for every 18,000 tweets, it’s not the endless Twittering that is causing de-forestation.

[div class=attrib]Infographic courtesy of Tim Cooley.[end-div]