Tag Archives: map

Global Domination — One Pixel at a Time

google-maps-article

Google’s story began with text-based search and was quickly followed by digital maps. These simple innovations ushered in the company’s mission to organize the world’s information. But as Google ventures further from its roots into mobile operating systems (Android), video (youtube), social media (Google+), smartphone hardware (through its purchase of Motorola’s mobile business), augmented reality (Google Glass), Web browsers (Chrome) and notebook hardware (Chromebook) what of its core mapping service? And is global domination all that it’s cracked up to be?

From the NYT:

Fifty-five miles and three days down the Colorado River from the put-in at Lee’s Ferry, near the Utah-Arizona border, the two rafts in our little flotilla suddenly encountered a storm. It sneaked up from behind, preceded by only a cool breeze. With the canyon walls squeezing the sky to a ribbon of blue, we didn’t see the thunderhead until it was nearly on top of us.

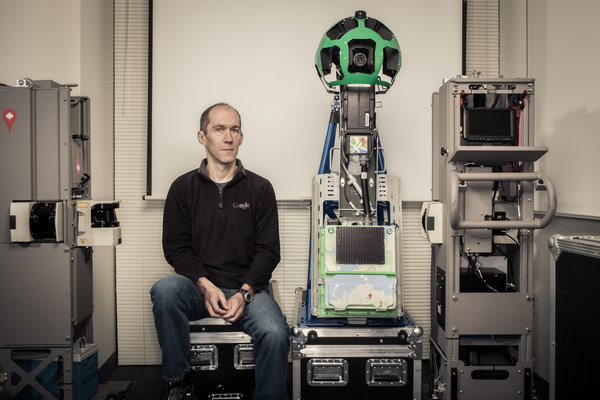
I was seated in the front of the lead raft. Pole position meant taking a dunk through the rapids, but it also put me next to Luc Vincent, the expedition’s leader. Vincent is the man responsible for all the imagery in Google’s online maps. He’s in charge of everything from choosing satellite pictures to deploying Google’s planes around the world to sending its camera-equipped cars down every road to even this, a float through the Grand Canyon. The raft trip was a mapping expedition that was also serving as a celebration: Google Maps had just introduced a major redesign, and the outing was a way of rewarding some of the team’s members.

Vincent wore a black T-shirt with the eagle-globe-and-anchor insignia of the United States Marine Corps on his chest and the slogan “Pain is weakness leaving the body” across his back. Though short in stature, he has the upper-body strength of an avid rock climber. He chose to get his Ph.D. in computer vision, he told me, because the lab happened to be close to Fontainebleau — the famous climbing spot in France. While completing his postdoc at the Harvard Robotics Lab, he led a successful expedition up Denali, the highest peak in North America.

A Frenchman who has lived half his 49 years in the United States, Vincent was never in the Marines. But he is a leader in a new great game: the Internet land grab, which can be reduced to three key battles over three key conceptual territories. What came first, conquered by Google’s superior search algorithms. Who was next, and Facebook was the victor. But where, arguably the biggest prize of all, has yet to be completely won.

Where-type questions — the kind that result in a little map popping up on the search-results page — account for some 20 percent of all Google queries done from the desktop. But ultimately more important by far is location-awareness, the sort of geographical information that our phones and other mobile devices already require in order to function. In the future, such location-awareness will be built into more than just phones. All of our stuff will know where it is — and that awareness will imbue the real world with some of the power of the virtual. Your house keys will tell you that they’re still on your desk at work. Your tools will remind you that they were lent to a friend. And your car will be able to drive itself on an errand to retrieve both your keys and your tools.

While no one can say exactly how we will get from the current moment to that Jetsonian future, one thing for sure can be said about location-awareness: maps are required. Tomorrow’s map, integrally connected to everything that moves (the keys, the tools, the car), will be so fundamental to their operation that the map will, in effect, be their operating system. A map is to location-awareness as Windows is to a P.C. And as the history of Microsoft makes clear, a company that controls the operating system controls just about everything. So the competition to make the best maps, the thinking goes, is more than a struggle over who dominates the trillion-dollar smartphone market; it’s a contest over the future itself.

Google was relatively late to this territory. Its map was only a few months old when it was featured at Tim O’Reilly’s inaugural Where 2.0 conference in 2005. O’Reilly is a publisher and a well-known visionary in Silicon Valley who is convinced that the Internet is evolving into a single vast, shared computer, one of whose most important individual functions, or subroutines, is location-awareness.

Google’s original map was rudimentary, essentially a digitized road atlas. Like the maps from Microsoft and Yahoo, it used licensed data, and areas outside the United States and Europe were represented as blue emptiness. Google’s innovation was the web interface: its map was dragable, zoomable, panable.

These new capabilities were among the first implementations of a technology that turned what had been a static medium — a web of pages — into a dynamic one. MapQuest and similar sites showed you maps; Google let you interact with them. Developers soon realized that they could take advantage of that dynamism to hack Google’s map, add their own data and create their very own location-based services.

A computer scientist named Paul Rademacher did just that when he invented a technique to facilitate apartment-hunting in San Francisco. Frustrated by the limited, bare-bones nature of Craigslist’s classified ads and inspired by Google’s interactive quality, Rademacher spent six weeks overlaying Google’s map with apartment listings from Craigslist. The result, HousingMaps.com, was one of the web’s first mash-ups.

Read the entire article here.

Image: Luc Vincent, head of Google Maps imagery. Courtesy of NYT Magazine.

MondayMap: Slavery 2013

A modern day map for a detestable blight that humans refuse to eradicate. We have notions that slavery was a distant problem caused by the ancient Egyptians or the Roman colonizers or, more recently, 18th century plantation owners. But, unfortunately, there are around 30 million slaves today — a thoroughly shameful statistic.

From the Washington Post:

We think of slavery as a practice of the past, an image from Roman colonies or 18th-century American plantations, but the practice of enslaving human beings as property still exists. There are 29.8 million people living as slaves right now, according to a comprehensive new report issued by the Australia-based Walk Free Foundation.

This is not some softened, by-modern-standards definition of slavery. These 30 million people are living as forced laborers, forced prostitutes, child soldiers, child brides in forced marriages and, in all ways that matter, as pieces of property, chattel in the servitude of absolute ownership. Walk Free investigated 162 countries and found slaves in every single one. But the practice is far worse in some countries than others.

The country where you are most likely to be enslaved is Mauritania. Although this vast West African nation has tried three times to outlaw slavery within its borders, it remains so common that it is nearly normal. The report estimates that four percent of Mauritania is enslaved – one out of every 25 people. (The aid group SOS Slavery, using a broader definition of slavery, estimated several years ago that as  many as 20 percent of Mauritanians might be enslaved.)

The map at the top of this page shows almost every country in the world colored according to the share of its population that is enslaved. The rate of slavery is also alarmingly high in Haiti, in Pakistan and in India, the world’s second-most populous country. In all three, more than 1 percent of the population is estimated to live in slavery.

A few trends are immediately clear from the map up top. First, rich, developed countries tend to have by far the lowest rates of slavery. The report says that effective government policies, rule of law, political stability and development levels all make slavery less likely. The vulnerable are less vulnerable, those who would exploit them face higher penalties and greater risk of getting caught. A war, natural disaster or state collapse is less likely to force helpless children or adults into bondage. Another crucial factor in preventing slavery is discrimination. When society treats women, ethnic groups or religious minorities as less valuable or less worthy of protection, they are more likely to become slaves.

Then there are the worst-affected regions. Sub-Saharan Africa is a swath of red, with many countries having roughly 0.7 percent of the population enslaved — or one in every 140 people. The legacies of the transatlantic slave trade and European colonialism are still playing out in the region; ethnic divisions and systems of economic exploitation engineered there during the colonial era are still, to some extent, in place. Slavery is also driven by extreme poverty, high levels of corruption and toleration of child “marriages” of young girls to adult men who pay their parents a “dowry.”

Two other bright red regions are Southeast Asia and Eastern Europe. Both are blighted particularly by sex trafficking, a practice that bears little resemblance to popular Western conceptions of prostitution. Women and men are coerced into participating, often starting at a very young age, and are completely reliant on their traffickers for not just their daily survival but basic life choices; they have no say in where they go or what they do and are physically prevented from leaving. International sex traffickers have long targeted these two regions, whose women and men are prized for their skin tones and appearance by Western patrons.

Yes, this map can be a little misleading. The United States, per capita, has a very low rate of slavery: just 0.02 percent, or one in every 5,000 people. But that adds up to a lot: an estimated 60,000 slaves, right here in America.

If your goal is to have as few slaves as possible — Walk Free says it is working to eradicate the practice in one generation’s time — then this map is very important, because it shows you which countries have the most slaves and thus which governments can do the most to reduce the global number of slaves. In that sense, the United States could stand to do a lot.

You don’t have to go far to see slavery in America. Here in Washington, D.C., you can sometimes spot them on certain streets, late at night. Not all sex workers or “prostitutes” are slaves, of course; plenty have chosen the work voluntarily and can leave it freely. But, as the 2007 documentary “Very Young Girls” demonstrated, many are coerced into participating at a young age and gradually shifted into a life that very much resembles slavery.

A less visible but still prevalent form of slavery in America involves illegal migrant laborers who are lured with the promise of work and then manipulated into forced servitude, living without wages or freedom of movement, under constant threat of being turned over to the police should they let up in their work. Walk Free cites “a highly developed criminal economy that preys on economic migrants, trafficking and enslaving them.” That economy stretches from the migrants’ home countries right to the United States.

The country that is most marked by slavery, though, is clearly India. There are an estimated 14 million slaves in India – it would be as if the entire population of Pennsylvania were forced into slavery. The country suffers deeply from all major forms of slavery, according to the report. Forced labor is common, due in part to a system of hereditary debt bondage; many Indian children are born “owing” sums they could never possibly pay to masters who control them as chattel their entire lives. Others fall into forced labor when they move to a different region looking for work, and turn to an unlicensed “broker” who promises work but delivers them into servitude. The country’s caste system and widespread discrimination abet social norms that make it easier to turn a blind eye to the problem. Women and girls from underprivileged classes are particularly vulnerable to sexual slavery, whether under the guise of “child marriages” or not, although men and boys often fall victim as well.

Read the entire article here.

Image courtesy of Washington Post.

MondayMap: Human History

How does one condense four thousand years of human history into a single view? Well, John Sparks did just that with his histomap in 1931.

From Slate:

This “Histomap,” created by John B. Sparks, was first printed by Rand McNally in 1931. (The David Rumsey Map Collection hosts a fully zoomable version here.) (Update: Click on the image below to arrive at a bigger version.)

This giant, ambitious chart fit neatly with a trend in nonfiction book publishing of the 1920s and 1930s: the “outline,” in which large subjects (the history of the world! every school of philosophy! all of modern physics!) were distilled into a form comprehensible to the most uneducated layman.

The 5-foot-long Histomap was sold for $1 and folded into a green cover, which featured endorsements from historians and reviewers. The chart was advertised as “clear, vivid, and shorn of elaboration,” while at the same time capable of “holding you enthralled” by presenting:

the actual picture of the march of civilization, from the mud huts of the ancients thru the monarchistic glamour of the middle ages to the living panorama of life in present day America.

The chart emphasizes domination, using color to show how the power of various “peoples” (a quasi-racial understanding of the nature of human groups, quite popular at the time) evolved throughout history.

It’s unclear what the width of the colored streams is meant to indicate. In other words, if the Y axis of the chart clearly represents time, what does the X axis represent? Did Sparks see history as a zero-sum game, in which peoples and nations would vie for shares of finite resources? Given the timing of his enterprise—he made this chart between two world wars and at the beginning of a major depression—this might well have been his thinking.

Sparks followed up on the success of this Histomap by publishing at least two more: the Histomap of religion (which I’ve been unable to find online) and the Histomap of evolution.

Read the entire article a check out the zoomable histomap here.

MondayMap: Feeding the Mississippi

The system of streams and tributaries that feeds the great Mississippi river is a complex interconnected web covering around half of the United States. A new mapping tool puts it all in one intricate chart.

From Slate:

A new online tool released by the Department of the Interior this week allows users to select any major stream and trace it up to its sources or down to its watershed. The above map, exported from the tool, highlights all the major tributaries that feed into the Mississippi River, illustrating the river’s huge catchment area of approximately 1.15 million square miles, or 37 percent of the land area of the continental U.S. Use the tool to see where the streams around you are getting their water (and pollution).

See a larger version of the map here.

Image: Map of the Mississippi river system. Courtesy of Nationalatlas.gov.

MondayMap: U.S. Interstate Highway System

It’s summer, which means lots of people driving every-which-way for family vacations.

So, this is a good time to refresh you with the map of the arteries that distribute lifeblood across the United States — the U.S. Interstate Highway System. The network of highways stretching around 46,800 miles from coast to coast is sometimes referred to as the Eisenhower Interstate System. President Eisenhower signed the Federal-Aid Highway Act in June 29, 1956 making the current system possible.

Thus the father of the Interstate System is also responsible for the never-ending choruses of: “are we there yet?”, “how much further?”, “I need to go to the bathroom”, and “can we stop at the next Starbucks (from the adults) / McDonalds (from the kids)?”.

Get a full-size map here.

Map courtesy of WikiCommons.

MondayMap: The Double Edge of Climate Change

So the changing global climate will imperil our coasts, flood low-lying lands, fuel more droughts, increase weather extremes, and generally make the planet more toasty. But, a new study — for the first time — links increasing levels of CO2 to an increase in global vegetation. Perhaps this portends our eventual fate — ceding the Earth back to the plants — unless humans make some drastic behavioral changes.

From the New Scientist:

The planet is getting lusher, and we are responsible. Carbon dioxide generated by human activity is stimulating photosynthesis and causing a beneficial greening of the Earth’s surface.

For the first time, researchers claim to have shown that the increase in plant cover is due to this “CO2 fertilisation effect” rather than other causes. However, it remains unclear whether the effect can counter any negative consequences of global warming, such as the spread of deserts.

Recent satellite studies have shown that the planet is harbouring more vegetation overall, but pinning down the cause has been difficult. Factors such as higher temperatures, extra rainfall, and an increase in atmospheric CO2 – which helps plants use water more efficiently – could all be boosting vegetation.

To home in on the effect of CO2, Randall Donohue of Australia’s national research institute, the CSIRO in Canberra, monitored vegetation at the edges of deserts in Australia, southern Africa, the US Southwest, North Africa, the Middle East and central Asia. These are regions where there is ample warmth and sunlight, but only just enough rainfall for vegetation to grow, so any change in plant cover must be the result of a change in rainfall patterns or CO2 levels, or both.

If CO2 levels were constant, then the amount of vegetation per unit of rainfall ought to be constant, too. However, the team found that this figure rose by 11 per cent in these areas between 1982 and 2010, mirroring the rise in CO2 (Geophysical Research Letters, doi.org/mqx). Donohue says this lends “strong support” to the idea that CO2 fertilisation drove the greening.

Climate change studies have predicted that many dry areas will get drier and that some deserts will expand. Donohue’s findings make this less certain.

However, the greening effect may not apply to the world’s driest regions. Beth Newingham of the University of Idaho, Moscow, recently published the result of a 10-year experiment involving a greenhouse set up in the Mojave desert of Nevada. She found “no sustained increase in biomass” when extra CO2 was pumped into the greenhouse. “You cannot assume that all these deserts respond the same,” she says. “Enough water needs to be present for the plants to respond at all.”

The extra plant growth could have knock-on effects on climate, Donohue says, by increasing rainfall, affecting river flows and changing the likelihood of wildfires. It will also absorb more CO2 from the air, potentially damping down global warming but also limiting the CO2 fertilisation effect itself.

Read the entire article here.

Image: Global vegetation mapped: Normalized Difference Vegetation Index (NDVI) from Nov. 1, 2007, to Dec. 1, 2007, during autumn in the Northern Hemisphere. This monthly average is based on observations from the Moderate Resolution Imaging Spectroradiometer (MODIS) on NASA’s Terra satellite. The greenness values depict vegetation density; higher values (dark greens) show land areas with plenty of leafy green vegetation, such as the Amazon Rainforest. Lower values (beige to white) show areas with little or no vegetation, including sand seas and Arctic areas. Areas with moderate amounts of vegetation are pale green. Land areas with no data appear gray, and water appears blue. Courtesy of NASA.

MondayMap: Your Taxes and Google Street View

The fear of an annual tax audit brings many people to their knees. It’s one of many techniques that government authorities use to milk their citizens of every last penny of taxes. Well, authorities now have an even more powerful weapon to add to their tax collecting arsenal — Google Street View. And, if you are reading this from Lithuania you will know what we are talking about.

From the Wall Street Journal:

One day last summer, a woman was about to climb into a hammock in the front yard of a suburban house here when a photographer for the Google Inc. Street View service snapped her picture.

The apparently innocuous photograph is now being used as evidence in a tax-evasion case brought by Lithuanian authorities against the undisclosed owners of the home.

Some European countries have been going after Google, complaining that the search giant is invading the privacy of their citizens. But tax inspectors here have turned to the prying eyes of Street View for their own purposes.

After Google’s car-borne cameras were driven through the Vilnius area last year, the tax men in this small Baltic nation got busy. They have spent months combing through footage looking for unreported taxable wealth.

“We were very impressed,” said Modestas Kaseliauskas, head of the State Tax Authority. “We realized that we could do more with less and in shorter time.”

More than 100 people have been identified so far after investigators compared Street View images of about 500 properties with state property registries looking for undeclared construction.

Two recent cases netted $130,000 in taxes and penalties after investigators found houses photographed by Google that weren’t on official maps.

From aerial surveillance to dedicated iPhone apps, cash-strapped governments across Europe are employing increasingly unconventional measures against tax cheats to raise revenue. In some countries, authorities have tried to enlist citizens to help keep watch. Customers in Greece, for instance, are insisting on getting receipts for what they buy.

For Lithuania, which only two decades ago began its transition away from communist central planning and remains one of the poorest countries in the European Union, Street View has been a big help. After the global financial crisis struck in 2008, belt tightening cut the tax authority’s budget by a third. A quarter of its employees were let go, leaving it with fewer resources just as it was being asked to do more.

“We were pressured to increase tax revenue,” said the authority’s Mr. Kaseliauskas.

Street View has let Mr. Kaseliauskas’s team see things it would have otherwise missed. Its images are better—and cheaper—than aerial photos, which authorities complain often aren’t clear enough to be useful.

Sitting in their city office 10 miles away, they were able to detect that, contrary to official records, the house with the hammock existed and that, in one photograph, three cars were parked in the driveway.

An undeclared semidetached house owned by the former board chairman of Bank Snoras, Raimundas Baranauskas, was recently identified using Street View and is estimated by the government to be worth about $260,000. Authorities knew Mr. Baranauskas owned land there, but not buildings. A quick look online led to the discovery of several houses on his land, in a quiet residential street of Vilnius.

Read the entire article here.

Image courtesy of (who else?), Google Maps.

MondayMap: Global Intolerance

Following on from last week’s MondayMap post on intolerance and hatred within the United States — according to tweets on the social media site Twitter — we expand our view this week to cover the globe. This map is a based on a more detailed, global research study of people’s attitudes to having neighbors of a different race.

From the Washington Post:

When two Swedish economists set out to examine whether economic freedom made people any more or less racist, they knew how they would gauge economic freedom, but they needed to find a way to measure a country’s level of racial tolerance. So they turned to something called the World Values Survey, which has been measuring global attitudes and opinions for decades.

Among the dozens of questions that World Values asks, the Swedish economists found one that, they believe, could be a pretty good indicator of tolerance for other races. The survey asked respondents in more than 80 different countries to identify kinds of people they would not want as neighbors. Some respondents, picking from a list, chose “people of a different race.” The more frequently that people in a given country say they don’t want neighbors from other races, the economists reasoned, the less racially tolerant you could call that society. (The study concluded that economic freedom had no correlation with racial tolerance, but it does appear to correlate with tolerance toward homosexuals.)

Unfortunately, the Swedish economists did not include all of the World Values Survey data in their final research paper. So I went back to the source, compiled the original data and mapped it out on the infographic above. In the bluer countries, fewer people said they would not want neighbors of a different race; in red countries, more people did.

If we treat this data as indicative of racial tolerance, then we might conclude that people in the bluer countries are the least likely to express racist attitudes, while the people in red countries are the most likely.

Update: Compare the results to this map of the world’s most and least diverse countries.

Before we dive into the data, a couple of caveats. First, it’s entirely likely that some people lied when answering this question; it would be surprising if they hadn’t. But the operative question, unanswerable, is whether people in certain countries were more or less likely to answer the question honestly. For example, while the data suggest that Swedes are more racially tolerant than Finns, it’s possible that the two groups are equally tolerant but that Finns are just more honest. The willingness to state such a preference out loud, though, might be an indicator of racial attitudes in itself. Second, the survey is not conducted every year; some of the results are very recent and some are several years old, so we’re assuming the results are static, which might not be the case.

• Anglo and Latin countries most tolerant. People in the survey were most likely to embrace a racially diverse neighbor in the United Kingdom and its Anglo former colonies (the United States, Canada, Australia and New Zealand) and in Latin America. The only real exceptions were oil-rich Venezuela, where income inequality sometimes breaks along racial lines, and the Dominican Republic, perhaps because of its adjacency to troubled Haiti. Scandinavian countries also scored high.

• India, Jordan, Bangladesh and Hong Kong by far the least tolerant. In only three of 81 surveyed countries, more than 40 percent of respondents said they would not want a neighbor of a different race. This included 43.5 percent of Indians, 51.4 percent of Jordanians and an astonishingly high 71.8 percent of Hong Kongers and 71.7 percent of Bangladeshis.

Read more about this map here.

MondayMap: Intolerance and Hatred

A fascinating map of tweets espousing hatred and racism across the United States. The data analysis and map were developed by researchers at Humboldt State University.

From the Guardian:

[T]he students and professors at Humboldt State University who produced this map read the entirety of the 150,000 geo-coded tweets they analysed.

Using humans rather than machines means that this research was able to avoid the basic pitfall of most semantic analysis where a tweet stating ‘the word homo is unacceptable’ would still be classed as hate speech. The data has also been ‘normalised’, meaning that the scale accounts for the total twitter traffic in each county so that the final result is something that shows the frequency of hateful words on Twitter. The only question that remains is whether the views of US Twitter users can be a reliable indication of the views of US citizens.

See the interactive map and read the entire article here.

MondayMap: Quiet News Day = Map of the Universe

It was surely a quiet news day on March 21 2013 — most major online news outlets showed a fresh map of the Cosmic Microwave Background (CMB) on the front page. It was taken by the Planck Telescope, operated by the European Space Agency, over a period of 15 months. The image shows a landscape of primordial cosmic microwaves from when the universe was only around 380,000 years old, and is often referred to as “first light”.

From ESA:

Acquired by ESA’s Planck space telescope, the most detailed map ever created of the cosmic microwave background – the relic radiation from the Big Bang – was released today revealing the existence of features that challenge the foundations of our current understanding of the Universe.

The image is based on the initial 15.5 months of data from Planck and is the mission’s first all-sky picture of the oldest light in our Universe, imprinted on the sky when it was just 380 000 years old.

At that time, the young Universe was filled with a hot dense soup of interacting protons, electrons and photons at about 2700ºC. When the protons and electrons joined to form hydrogen atoms, the light was set free. As the Universe has expanded, this light today has been stretched out to microwave wavelengths, equivalent to a temperature of just 2.7 degrees above absolute zero.

This ‘cosmic microwave background’ – CMB – shows tiny temperature fluctuations that correspond to regions of slightly different densities at very early times, representing the seeds of all future structure: the stars and galaxies of today.

According to the standard model of cosmology, the fluctuations arose immediately after the Big Bang and were stretched to cosmologically large scales during a brief period of accelerated expansion known as inflation.

Planck was designed to map these fluctuations across the whole sky with greater resolution and sensitivity than ever before. By analysing the nature and distribution of the seeds in Planck’s CMB image, we can determine the composition and evolution of the Universe from its birth to the present day.

Overall, the information extracted from Planck’s new map provides an excellent confirmation of the standard model of cosmology at an unprecedented accuracy, setting a new benchmark in our manifest of the contents of the Universe.

But because precision of Planck’s map is so high, it also made it possible to reveal some peculiar unexplained features that may well require new physics to be understood.

“The extraordinary quality of Planck’s portrait of the infant Universe allows us to peel back its layers to the very foundations, revealing that our blueprint of the cosmos is far from complete. Such discoveries were made possible by the unique technologies developed for that purpose by European industry,” says Jean-Jacques Dordain, ESA’s Director General.

“Since the release of Planck’s first all-sky image in 2010, we have been carefully extracting and analysing all of the foreground emissions that lie between us and the Universe’s first light, revealing the cosmic microwave background in the greatest detail yet,” adds George Efstathiou of the University of Cambridge, UK.

One of the most surprising findings is that the fluctuations in the CMB temperatures at large angular scales do not match those predicted by the standard model – their signals are not as strong as expected from the smaller scale structure revealed by Planck.

Read the entire article after the jump.

Image: Cosmic microwave background (CMB) seen by Planck. Courtesy of ESA (European Space Agency).

MondayMap: New Jersey Under Water

We love maps here at theDiagonal. So much so that we’ve begun a new feature: MondayMap. As the name suggests, we plan to feature fascinating new maps on Mondays. For our readers who prefer their plots served up on a Saturday, sorry. Usually we like to highlight maps that cause us to look at our world differently or provide a degree of welcome amusement, such as the wonderful trove of maps over at Strange Maps curated by Frank Jacobs.

However, this first MondayMap is a little different and serious. It’s an interactive map that shows the impact of estimated sea level rise on the streets of New Jersey. Obviously, such a tool would be a great boon for emergency services and urban planners. For the rest of us, whether we live in New Jersey or not, maps like this one — of extreme weather events and projections — are likely to become much more common over the coming decades. Kudos to researchers at Rutgers University for developing the NJ Flood Mapper.

[div class=attrib]From Wall Street Journal:[end-div]

While superstorm Sandy revealed the Northeast’s vulnerability, a new map by New Jersey scientists suggests how rising seas could make future storms even worse.

The map shows ocean waters surging more than a mile into communities along Raritan Bay, engulfing nearly all of New Jersey’s barrier islands and covering northern sections of the New Jersey Turnpike and land surrounding the Port Newark Container Terminal.

Such damage could occur under a scenario in which sea levels rise 6 feet—or a 3-foot rise in tandem with a powerful coastal storm, according to the map produced by Rutgers University researchers.

The satellite-based tool, one of the first comprehensive, state-specific maps of its kind, uses a Google-maps-style interface that allows viewers to zoom into street-level detail.

“We are not trying to unduly frighten people,” said Rick Lathrop, director of the Grant F. Walton Center for Remote Sensing and Spatial Analysis at Rutgers, who led the map’s development. “This is providing people a look at where our vulnerability is.”

Still, the implications of the Rutgers project unnerve residents of Surf City, on Long Beach Island, where the map shows water pouring over nearly all of the barrier island’s six municipalities with a 6-foot increase in sea levels.

“The water is going to come over the island and there will be no island,” said Barbara Epstein, a 73-year-old resident of nearby Barnegat Light, who added that she is considering moving after 12 years there. “The storms are worsening.”

To be sure, not everyone agrees that climate change will make sea-level rise more pronounced.

Politically, climate change remains an issue of debate. New York Gov. Andrew Cuomo has said Sandy showed the need to address the issue, while New Jersey Gov. Chris Christie has declined to comment on whether Sandy was linked to climate change.

Scientists have gone ahead and started to map sea-level-rise scenarios in New Jersey, New York City and flood-prone communities along the Gulf of Mexico to help guide local development and planning.

Sea levels have risen by 1.3 feet near Atlantic City and 0.9 feet by Battery Park between 1911 and 2006, according to data from the National Oceanic and Atmospheric Administration.

A serious storm could add at least another 3 feet, with historic storm surges—Sandy-scale—registering at 9 feet. So when planning for future coastal flooding, 6 feet or higher isn’t far-fetched when combining sea-level rise with high tides and storm surges, Mr. Lathrop said.

NOAA estimated in December that increasing ocean temperatures could cause sea levels to rise by 1.6 feet in 100 years, and by 3.9 feet if considering some level of Arctic ice-sheet melt.

Such an increase amounts to 0.16 inches per year, but the eventual impact could mean that a small storm could “do the same damage that Sandy did,” said Peter Howd, co-author of a 2012 U.S. Geological Survey report that found the rate of sea level rise had increased in the northeast.

[div class=attrib]Read the entire article after the jump.[end-div]

[div class=attrib]Image: NJ Flood Mapper. Courtesy of Grant F. Walton Center for Remote Sensing and Spatial Analysis (CRSSA), Rutgers University, in partnership with the Jacques Cousteau National Estuarine Research Reserve (JCNERR), and in collaboration with the NOAA Coastal Services Center (CSC).[end-div]

From Sea to Shining Sea – By Rail

Now that air travel has become well and truly commoditized, and for most of us, a nightmare, it’s time, again, to revisit the romance of rail. After all, the elitist romance of air travel passed away about 40-50 years ago. Now all we are left with is parking trauma at the airport; endless lines at check in, security, the gate and while boarding and disembarking; inane airport announcements and beeping golf carts; coughing, tweeting passengers crammed shoulder to shoulder in far too small seats; poor quality air and poor quality service in the cabin. It’s even dangerous to open the shade and look out of the aircraft window for fear of waking a cranky neighbor, or, more calamitous still, for washing out the in-seat displays showing the latest reality TV videos.

Some of you, surely, still pine for a quiet and calming ride across the country taking in the local sights at a more leisurely pace. Alfred Twu, who helped define the 2008 high speed rail proposal for California, would have us zooming across the entire United States in trains, again. So, it not be a leisurely ride — think more like 200-300 miles per hour — but it may well bring us closer to what we truly miss when suspended at 30,000 ft. We can’t wait.

[div class=attrib]From the Guardian:[end-div]

I created this US High Speed Rail Map as a composite of several proposed maps from 2009, when government agencies and advocacy groups were talking big about rebuilding America’s train system.

Having worked on getting California’s high speed rail approved in the 2008 elections, I’ve long sung the economic and environmental benefits of fast trains.

This latest map comes more from the heart. It speaks more to bridging regional and urban-rural divides than about reducing airport congestion or even creating jobs, although it would likely do that as well.

Instead of detailing construction phases and service speeds, I took a little artistic license and chose colors and linked lines to celebrate America’s many distinct but interwoven regional cultures.

The response to my map this week went above and beyond my wildest expectations, sparking vigorous political discussion between thousands of Americans ranging from off-color jokes about rival cities to poignant reflections on how this kind of rail network could change long-distance relationships and the lives of faraway family members.

Commenters from New York and Nebraska talked about “wanting to ride the red line”. Journalists from Chattanooga, Tennessee (population 167,000) asked to reprint the map because they were excited to be on the map. Hundreds more shouted “this should have been built yesterday”.

It’s clear that high speed rail is more than just a way to save energy or extend economic development to smaller cities.

More than mere steel wheels on tracks, high speed rail shrinks space and brings farflung families back together. It keeps couples in touch when distant career or educational opportunities beckon. It calls to adventure and travel. It is duct tape and string to reconnect politically divided regions. Its colorful threads weave new American Dreams.

That said, while trains still live large in the popular imagination, decades of limited service have left some blind spots in the collective consciousness. I’ll address few here:

Myth: High speed rail is just for big city people.
Fact: Unlike airplanes or buses which must make detours to drop off passengers at intermediate points, trains glide into and out of stations with little delay, pausing for under a minute to unload passengers from multiple doors. Trains can, have, and continue to effectively serve small towns and suburbs, whereas bus service increasingly bypasses them.

I do hear the complaint: “But it doesn’t stop in my town!” In the words of one commenter, “the train doesn’t need to stop on your front porch.” Local transit, rental cars, taxis, biking, and walking provide access to and from stations.

Myth: High speed rail is only useful for short distances.
Fact: Express trains that skip stops allow lines to serve many intermediate cities while still providing some fast end-to-end service. Overnight sleepers with lie-flat beds where one boards around dinner and arrives after breakfast have been successful in the US before and are in use on China’s newest 2,300km high speed line.

[div class=attrib]Read the entire article following the jump.[end-div]

[div class=attrib]Image: U.S. High Speed Rail System proposal. Alfred Twu created this map to showcase what could be possible.[end-div]

Beware North Korea, Google is Watching You

This week Google refreshed its maps of North Korea. What was previously a blank canvas with only the country’s capital — Pyongyang — visible, now boasts roads, hotels, monuments and even some North Korean internment camps. While this is not the first detailed map of the secretive state it is an important milestone in Google’s quest to map us all.

[div class=attrib]From the Washington Post:[end-div]

Until Tuesday, North Korea appeared on Google Maps as a near-total white space — no roads, no train lines, no parks and no restaurants. The only thing labeled was the capital city, Pyongyang.

This all changed when Google, on Tuesday, rolled out a detailed map of one of the world’s most secretive states. The new map labels everything from Pyongyang’s subway stops to the country’s several city-sized gulags, as well as its monuments, hotels, hospitals and department stores.

According to a Google blog post, the maps were created by a group of volunteer “citizen cartographers,” through an interface known as Google Map Maker. That program — much like Wikipedia — allows users to submit their own data, which is then fact-checked by other users, and sometimes altered many times over. Similar processes were used in other once-unmapped countries like Afghanistan and Burma.

In the case of North Korea, those volunteers worked from outside of the country, beginning from 2009. They used information that was already public, compiling details from existing analog maps, satellite images, or other Web-based materials. Much of the information was already available on the Internet, said Hwang Min-woo, 28, a volunteer mapmaker from Seoul who worked for two years on the project.

North Korea was the last country virtually unmapped by Google, but other — even more detailed — maps of the North existed before this. Most notable is a map created by Curtis Melvin, who runs the North Korea Economy Watch blog and spent years identifying thousands of landmarks in the North: tombs, textile factories, film studios, even rumored spy training locations. Melvin’s map is available as a downloadable Google Earth file.

Google’s map is important, though, because it is so readily accessible.  The map is unlikely to have an immediate influence in the North, where Internet use is restricted to all but a handful of elites. But it could prove beneficial for outsider analysts and scholars, providing an easy-to-access record about North Korea’s provinces, roads, landmarks, as well as hints about its many unseen horrors.

[div class=attrib]Read the entire article and check out more maps after the jump.[end-div]

Map as Illusion

We love maps here at theDiagonal. We also love ideas that challenge the status quo. And, this latest Strange Map, courtesy of Frank Jacobs over at Big Think does both. What we appreciate about his cartographic masterpiece is that it challenges our visual perception, and, more importantly, challenges our assumed hemispheric worldview.

[div class=attrib]Read more of this article after the jump.[end-div]

Big Brother is Mapping You

One hopes that Google’s intention to “organize the world’s information” will remain benign for the foreseeable future. Yet, as more and more of our surroundings and moves are mapped and tracked online, and increasingly offline, it would be wise to remain ever vigilant. Many put up with the encroachment of advertisers and promoters into almost every facet of their daily lives as a necessary, modern evil. But where is the dividing line that separates an ignorable irritation from an intrusion of privacy and a grab for control? For the paranoid amongst us, it may only be a matter of time before our digital footprints come under the increasing scrutiny, and control, of organizations with grander designs.

[div class=attrib]From the Guardian:[end-div]

Eight years ago, Google bought a cool little graphics business called Keyhole, which had been working on 3D maps. Along with the acquisition came Brian McClendon, aka “Bam”, a tall and serious Kansan who in a previous incarnation had supplied high-end graphics software that Hollywood used in films including Jurassic Park and Terminator 2. It turned out to be a very smart move.

Today McClendon is Google’s Mr Maps – presiding over one of the fastest-growing areas in the search giant’s business, one that has recently left arch-rival Apple red-faced and threatens to make Google the most powerful company in mapping the world has ever seen.

Google is throwing its considerable resources into building arguably the most comprehensive map ever made. It’s all part of the company’s self-avowed mission is to organize all the world’s information, says McClendon.

“You need to have the basic structure of the world so you can place the relevant information on top of it. If you don’t have an accurate map, everything else is inaccurate,” he says.

It’s a message that will make Apple cringe. Apple triggered howls of outrage when it pulled Google Maps off the latest iteration of its iPhone software for its own bug-riddled and often wildly inaccurate map system. “We screwed up,” Apple boss Tim Cook said earlier this week.

McClendon, pictured, won’t comment on when and if Apple will put Google’s application back on the iPhone. Talks are ongoing and he’s at pains to point out what a “great” product the iPhone is. But when – or if – Apple caves, it will be a huge climbdown. In the meantime, what McClendon really cares about is building a better map.

This not the first time Google has made a landgrab in the real world, as the publishing industry will attest. Unhappy that online search was missing all the good stuff inside old books, Google – controversially – set about scanning the treasures of Oxford’s Bodleian library and some of the world’s other most respected collections.

Its ambitions in maps may be bigger, more far reaching and perhaps more controversial still. For a company developing driverless cars and glasses that are wearable computers, maps are a serious business. There’s no doubting the scale of McClendon’s vision. His license plate reads: ITLLHPN.

Until the 1980s, maps were still largely a pen and ink affair. Then mainframe computers allowed the development of geographic information system software (GIS), which was able to display and organise geographic information in new ways. By 2005, when Google launched Google Maps, computing power allowed GIS to go mainstream. Maps were about to change the way we find a bar, a parcel or even a story. Washington DC’s homicidewatch.org, for example, uses Google Maps to track and follow deaths across the city. Now the rise of mobile devices has pushed mapping into everyone’s hands and to the front line in the battle of the tech giants.

It’s easy to see why Google is so keen on maps. Some 20% of Google’s queries are now “location specific”. The company doesn’t split the number out but on mobile the percentage is “even higher”, says McClendon, who believes maps are set to unfold themselves ever further into our lives.

Google’s approach to making better maps is about layers. Starting with an aerial view, in 2007 Google added Street View, an on-the-ground photographic map snapped from its own fleet of specially designed cars that now covers 5 million of the 27.9 million miles of roads on Google Maps.

Google isn’t stopping there. The company has put cameras on bikes to cover harder-to-reach trails, and you can tour the Great Barrier Reef thanks to diving mappers. Luc Vincent, the Google engineer known as “Mr Street View”, carried a 40lb pack of snapping cameras down to the bottom of the Grand Canyon and then back up along another trail as fellow hikers excitedly shouted “Google, Google” at the man with the space-age backpack. McClendon, pictured, has also played his part. He took his camera to Antarctica, taking 500 or more photos of a penguin-filled island to add to Google Maps. “The penguins were pretty oblivious. They just don’t care about people,” he says.

Now the company has projects called Ground Truth, which corrects errors online, and Map Maker, a service that lets people make their own maps. In the western world the product has been used to add a missing road or correct a one-way street that is pointing the wrong way, and to generally improve what’s already there. In Africa, Asia and other less well covered areas of the world, Google is – literally – helping people put themselves on the map.

In 2008, it could take six to 18 months for Google to update a map. The company would have to go back to the firm that provided its map information and get them to check the error, correct it and send it back. “At that point we decided we wanted to bring that information in house,” says McClendon. Google now updates its maps hundreds of times a day. Anyone can correct errors with roads signs or add missing roads and other details; Google double checks and relies on other users to spot mistakes.

Thousands of people use Google’s Map Maker daily to recreate their world online, says Michael Weiss-Malik, engineering director at Google Maps. “We have some Pakistanis living in the UK who have basically built the whole map,” he says. Using aerial shots and local information, people have created the most detailed, and certainly most up-to-date, maps of cities like Karachi that have probably ever existed. Regions of Africa and Asia have been added by map-mad volunteers.

[div class=attrib]Read the entire article following the jump.[end-div]

National Emotions Mapped

Are Canadians as a people more emotional than Brazilians? Are Brits as emotional as Mexicans? While generalizing and mapping a nation’s emotionality is dubious at best, this map is nonetheless fascinating.

[div class=atfrib]From the Washington Post:[end-div]

Since 2009, the Gallup polling firm has surveyed people in 150 countries and territories on, among other things, their daily emotional experience. Their survey asks five questions, meant to gauge whether the respondent felt significant positive or negative emotions the day prior to the survey. The more times that people answer “yes” to questions such as “Did you smile or laugh a lot yesterday?”, the more emotional they’re deemed to be.

Gallup has tallied up the average “yes” responses from respondents in almost every country on Earth. The results, which I’ve mapped out above, are as fascinating as they are indecipherable. The color-coded key in the map indicates the average percentage of people who answered “yes.” Dark purple countries are the most emotional, yellow the least. Here are a few takeaways.

Singapore is the least emotional country in the world. ”Singaporeans recognize they have a problem,” Bloomberg Businessweek writes of the country’s “emotional deficit,” citing a culture in which schools “discourage students from thinking of themselves as individuals.” They also point to low work satisfaction, competitiveness, and the urban experience: “Staying emotionally neutral could be a way of coping with the stress of urban life in a place where 82 percent of the population lives in government-built housing.”

The Philippines is the world’s most emotional country. It’s not even close; the heavily Catholic, Southeast Asian nation, a former colony of Spain and the U.S., scores well above second-ranked El Salvador.

Post-Soviet countries are consistently among the most stoic. Other than Singapore (and, for some reason, Madagascar and Nepal), the least emotional countries in the world are all former members of the Soviet Union. They are also the greatest consumers of cigarettes and alcohol. This could be what you call and chicken-or-egg problem: if the two trends are related, which one came first? Europe appears almost like a gradient here, with emotions increasing as you move West.

People in the Americas are just exuberant. Every nation on the North and South American continents ranked highly on the survey. Americans and Canadians are both among the 15 most emotional countries in the world, as well as ten Latin countries. The only non-American countries in the top 15, other than the Philippines, are the Arab nations of Oman and Bahrain, both of which rank very highly.

[div class=attrib]Read the entire article following the jump.[end-div]

The United Swing States of America

Frank Jacobs over at Strange Maps has found a timely reminder that shows the inordinate influence that a few voters in several crucial States have over the rest of us.

[div class=attrib]From Strange Maps:[end-div]

At the stroke of midnight on November 6th, the 21 registered voters of Dixville Notch, gathering in the wood-panelled Ballot Room of the Balsams Grand Resort Hotel, will have just one minute to cast their vote. Speed is of the essence, if the tiny New Hampshire town is to uphold its reputation (est. 1960) as the first place to declare its results in the US presidential elections.

Later that day, well over 200 million other American voters will face the same choice as the good folks of the Notch: returning Barack Obama to the White House for a second and final four-year term, or electing Mitt Romney as the 45th President of the United States.

The winner of that contest will not be determined by whoever wins a simple majority (i.e. 50% of all votes cast, plus at least one). Like many electoral processes across the world, the system to elect the next president of the United States is riddled with idiosyncrasies and peculiarities – the quadrennial quorum in Dixville Notch being just one example.

Even though most US Presidents have indeed gained office by winning the popular vote, but this is not always the case. What is needed, is winning the electoral vote. For the US presidential election is an indirect one: depending on the outcome in each of the 50 states, an Electoral College convenes in Washington DC to elect the President.

The total of 538 electors is distributed across the states in proportion to their population size, and is regularly adjusted to reflect increases or decreases. In 2008 Louisiana had 9 electors and South Carolina had 8; reflecting a relative population decrease, resp. increase, those numbers are now reversed.

Maine and Nebraska are the only states to assign their electors proportionally; the other 48 states (and DC) operate on the ABBA principle: however slight the majority of either candidate in any of those states, he would win all its electoral votes. This rather convoluted system underlines the fact that the US Presidential elections are the sum of 50, state-level contests. It also brings into focus that some states are more important than others.

Obviously, in this system the more populous states carry much more weight than the emptier ones. Consider the map of the United States, and focus on the 17 states west of the straight-ish line of state borders from North Dakota-Minnesota in the north to Texas-Louisiana in the south. Just two states – Texas and California – outweigh the electoral votes of the 15 others.

So presidential candidates concentrate their efforts on the states where they can hope to gain the greatest advantage. This excludes the fairly large number of states that are solidly ‘blue’ (i.e. Democratic) or ‘red’ (Republican). Texas, for example, is reliably Republican, while California can be expected to fall in the Democratic column.

[div class=attrib]Read the entire article after the jump.[end-div]

[div class=attrib]Map courtesy of Strange Maps / Big Think.[end-div]

Your Proximity to Fast Food

A striking map that shows how close or far you are from a McDonalds. If you love fast food then the Eastern U.S. is the place for you. On the other hand, if you crave McDistance, then you may want to move to the Nevada desert, the wilds of Idaho, the Rocky Mountains or the plains of the Dakotas. The map is based on 2009 data.

[div class=attrib]Read more details about this cool map after the jump.[end-div]

[div class=attrib]Map courtesy of Guardian / Stephen Von Worley, Data Pointed.[end-div]

GDP of States Versus Countries

A niffty or neat (depending upon your location) map courtesy of Frank Jacobs over at Strange Maps. This one shows countries in place of U.S. States where the GDP (Gross Domestic Product) is similar. For instance, Canada replaces Texas in the United States map since Canada’s entire GDP matches the economy of Texas. The map is based on data for 2007.

[div class=attrib]Read the entire article after the jump.[end-div]

British Literary Greats, Mapped

Frank Jacobs over at Strange Maps has found another really cool map. This one shows 181 British writers placed according to the part of the British Isles with which they are best associated.

[div class=attrib]From Strange Maps:[end-div]

Maps usually display only one layer of information. In most cases, they’re limited to the topography, place names and traffic infrastructure of a certain region. True, this is very useful, and in all fairness quite often it’s all we ask for. But to reduce cartography to a schematic of accessibility is to exclude the poetry of place.

Or in this case, the poetry and prose of place. This literary map of Britain is composed of the names of 181 British writers, each positioned in parts of the country with which they are associated.

This is not the best navigational tool imaginable. If you want to go from William Wordsworth to Alfred Tennyson, you could pass through Coleridge and Thomas Wyatt, slice through the Brontë sisters, step over Andrew Marvell and finally traverse Philip Larkin. All of which sounds kind of messy.

t’s also rather limited. To reduce the whole literary history of Britain to nine score and one writers can only be done by the exclusion of many other, at least equally worthy contributors to the country’s literary landscape. But completeness is not the point of this map: it is not an instrument for literary-historical navigation either. Its main purpose is sheer cartographic joy.

An added bonus is that we’re able to geo-locate some of English literature’s best-known names. Seamus Heaney is about as Irish as a pint of Guinness for breakfast on March 17th, but it’s a bit of a surprise to see C.S. Lewis placed in Northern Ireland as well. The writer of the Narnia saga is closely associated with Oxford, but was indeed born and raised in Belfast.

Thomas Hardy’s name fills out an area close to Wessex, the fictional west country where much of his stories are set. London is occupied by Ben Jonson and John Donne, among others. Hanging around the capital are Geoffrey Chaucer, who was born there, and Christopher Marlowe, a native of Canterbury. The Isle of Wight is formed by the names of David Gascoyne, the surrealist poet, and John Keats, the romantic poet. Neither was born on the island, but both spent some time there.

[div class=attrib]Read the entire article after the jump.[end-div]

Bike+GPS=Map Art

Frank Jacobs over at Strange Maps has found another “out in leftfield” map. This cartographic invention is courtesy of an artist who “paints” using his GPS-enabled bicycle.

[div class=attrib]From Strange Maps:[end-div]

GPS technology is opening up exciting new hybrid forms of mapping and art. Or in this case: cycling, mapping and art. The maps on this page are the product of Michael Wallace, a Baltimore-based artist who uses his bike as a paintbrush, and the city as his canvas.

As Wallace traces shapes and forms across Baltimore’s street grid, the GPS technology that tracks this movements fixes the fluid pattern of his pedalstrokes onto a map. The results are what Wallace calls GPX images, or ‘virtual geoglyphs’ [1].

These massive images, created over by now three riding seasons, “continue to generate happiness, fitness and imagination through planning the physical activity of ‘digital spray-painting’ my ‘local canvas’ with the help of tracking satellites 12,500 miles above.”

Wallace’s portfolio by now is filled with dozens of GPX images, ranging from pictures of a toilet to the Titanic. They even include a map of the US – traced on the map of Baltimore. How’s that for self-reference? Or for Bawlmer [2] hubris?

[div class=attrib]Read the entire article after the jump.[end-div]

Heavy Metal Density

Heavy Metal in the musical sense, not as in elements, such as iron or manganese, is really popular in Finland and Iceland. It even pops up in Iran and Saudia Arabia.

[div class=attrib]Frank Jacobs over at Strange Maps tells us more.[end-div]

This map reflects the number of heavy metal bands per 100,000 inhabitants for each country in the world. It codes the result on a colour temperature scale, with blue indicating low occurrence, and red high occurrence. The data for this map is taken from the extensive Encyclopaedia Metallum, an online archive of metal music that lists bands per country, and provides some background by listing their subgenre (Progressive Death Metal, Symphonic Gothic Metal, Groove Metal, etc).

Even if you barely know your Def Leppard from your Deep Purple, you won’t be surprised by the obvious point of this map: Scandinavia is the world capital of heavy metal music. Leaders of the pack are Finland and Sweden, coloured with the hottest shade of red. With 2,825 metal bands listed in the Encyclopaedia Metallum, the figure for Finland works out to 54.3 bands per 100,000 Finns (for a total of 5.2 million inhabitants). Second is Sweden, with a whopping 3,398 band entries. For 9.1 million Swedes, that amounts to 37.3 metal bands per 100,000 inhabitants.

The next-hottest shade of red is coloured in by Norway and Iceland. The Icelandic situation is interesting: with only 71 bands listed, the country seems not particulary metal-oriented. But the total population of the North Atlantic island is a mere 313,000. Which produces a result of 22.6 metal bands per 100,000 inhabitants. That’s almost the double, relatively speaking, of Denmark, which has a score of 12.9 (708 metal bands for 5.5 million Danes)

The following shades of colour, from dark orange to light yellow, are almost all found in North America, Europe and Australasia. A notable addition to this list of usual suspects are Israel, and the three countries of Latin America’s Southern Cone: Chile, Argentina and Uruguay.

Some interesting variations in Europe: Portugal is much darker – i.e. much more metal-oriented – than its Iberian neighbour Spain, and Greece is a solid southern outpost of metal on an otherwise wishy-washy Balkan Peninsula.

On the other side of the scale, light blue indicates the worst – or at least loneliest – places to be a metal fan: Papua New Guinea, North Korea, Cambodia, Afghanistan, Yemen, and most of Africa outside its northern and southern fringe. According to the Encyclopaedia Metallum, there isn’t a single metal band in any of those countries.

[div class=attrib]Read the entire article after the jump.[end-div]

Texi as the Plural for Texas?

Imagine more than one state of Texas. Or, imagine the division of Texas into a handful of sub-states smaller in size and perhaps more manageable. Frank Jacobs over at Strange Maps ponders a United States where there could be more than one Texas.

[div class=attrib]From Strange Maps:[end-div]

The plural of Texas? My money’s on Texases, even though that sounds almost as wrong as Texae, Texi or whatever alternative you might try to think up. Texas is defiantly singular. It is the Lone Star State, priding itself on its brief independence and distinct culture. Discounting Alaska, it is also the largest state in the Union.

Texas is both a maverick and a behemoth, and as much an claimant to exceptionalism within the US as America itself is on the world stage. Texans are superlative Americans. When other countries reach for an American archetype to caricature (or to demonise), it’s often one they imagine having a Texan drawl: the greedy oil baron, the fundamentalist preacher, the trigger-happy cowboy (1).

Texans will rightly object to being pigeonholed, but they probably won’t mind the implied reference to their tough-guy image. Nobody minds being provided with some room to swagger. See also the popularity of the slogan Don’t Mess With Texas, the state’s unofficial motto. It is less historical than it sounds, beginning life only in 1986 as the tagline of an anti-littering campaign.

You’d have to be crazy to mess with a state that’s this big and fierce. In fact, you’d have to be Texas to mess with Texas. Really. That’s not just a clever put-down. It’s the law. When Texas joined the Union in 1845, voluntarily giving up its independence, it was granted the right by Congress to form “new States of convenient size, not exceeding four in number and in addition to the said State of Texas.”

This would increase the total number of Texases to five, and enhance their political weight – at least in the US Senate, which would have to make room for 10 Senators from all five states combined, as opposed to just the twosome that represents the single state of Texas now.

In 2009, the political blog FiveThirtyEight overlaid their plan on a county-level map of the Obama-McCain presidential election results (showing Texas to be overwhelmingly red, except for a band of blue along the Rio Grande). The five Texases are:

  • (New) Texas, comprising the Austin-San Antonio metropolitan area in central Texas;
  • Trinity, uniting Dallas, Fort Worth and Arlington;
  • Gulfland, along the coast and including Houston;
  • Plainland, from Lubbock all the way up the panhandle (with 40% of Texas’s territory, the largest successor state);
  • El Norte, south of the other states but north of Mexico, where most of the new state’s 85% Hispanics would have their roots.

[div class=attrib]Read the entire article here.[end-div]

Map Your Favorite Red (Wine)

This season’s Beaujolais Nouveau is just over a month away so what better way to pave the road to French wines than a viticultural map. The wine map is based on the 1930’s iconic design by Harry Beck of the London Tube (subway).

[div class=attrib]From Frank Jacobs at Strange Maps:[end-div]

The coloured lines on this wine map denote the main wine-producing regions in France, the dots are significant cities or towns in those regions. Names that branch off from the main line via little streaks are the so-called appellations [2].

This schematic approach is illuminating for non-aficionados. In the first place, it clarifies the relation between region and appellation. For example: Médoc, Margaux and St-Emilion are three wines from the same region. So they are all Bordeaux wines, but each with its own appellation.

Secondly, it provides a good indication of the geographic relation between appellations within regions. Chablis and Nuits-St-Georges are northern Burgundy wines, while Beaujolais is a southern one. It also permits some comparison between regions: Beaujolais, although a Burgundy, neighbours Côte Rôtie, a northern Rhône Valley wine.

And lastly, it provides the names of the main grape varieties used in each region (the white ones italicised), like merlot or chardonnay.

Eurovision

If you grew up in Europe or have spent at least 6 months there over the last 50 years you’ll have collided with the Eurovision Song Contest.

A quintessentially european invention, Eurovision, as it is commonly know, has grown from a handful of countries to embrace 43 nations across Europe in 2012. Countries compete for the prize of best song and the honor of hosting the contest the following year. While contestants and song are not usually guaranteed long-standing commercial success, the winner usually does claim 15 minutes or so on the spotlight and at least a singular one-hit-wonder. A notable exceptions was the Swedish group ABBA, which went on to generation-spanning superstardom.

Frank Jacobs over at Strange Maps offers his cartographic take on Eurovision.

[div class=attrib]From Strange Maps / Big Think:[end-div]

The Eurovision Song Contest is a resounding success in at least one respect. Set up as a laboratory of European harmony – musically, audiovisually and politically – its first edition [1] featured a mere 7 participating countries, all Western European. The 57th edition, next May in Azerbaijan, will have 43 countries from all over the continent vying for the top prize, and the honour to host the 2013 edition of the event in their capital city.

Mission accomplished, then. But a chorus of critics – swelling, as the turn of phrase suggests [2] – finds the annual event increasingly tacky and irrelevant. The winner is determined by a tally of national votes, which have less to do with the quality of the songs than with the degree of friendliness between the participating countries.

[div class=attrib]More of the article here.[end-div]

A Holiday in Hell

Not quite as poetic and intricate as Dante’s circuitous map of hell but a fascinating invention by Tom Gauld nonetheless.

[div class=attrib]From Frank Jacobs for Strange Maps:[end-div]

“A perpetual holiday is a good working definition of hell”, said George Bernard Shaw; in fact, just the odd few weeks of summer vacation may be near enough unbearable – what with all the frantic packing and driving, the getting lost and having forgotten, the primitive lodgings, lousy food and miserable weather, not to mention the risk of disease and unfriendly natives.

And yet, even for the bored teenagers forced to join their parents’ on their annual work detox, the horrors of the summer holiday mix with the chance of thrilling adventures, beckoning beyond the unfamiliar horizon.

Tom Gauld may well have been such a teenager, for this cartoon of his deftly expresses both the eeriness and the allure of obligatory relaxation in a less than opportune location. It evokes both the ennui of being where you don’t want to be, and the exhilarating exotism of those surroundings – as if they were an endpaper map of a Boys’ Own adventure, waiting for the dotted line of your very own expedition.


[div class=attrib]More from theSource here.[end-div]